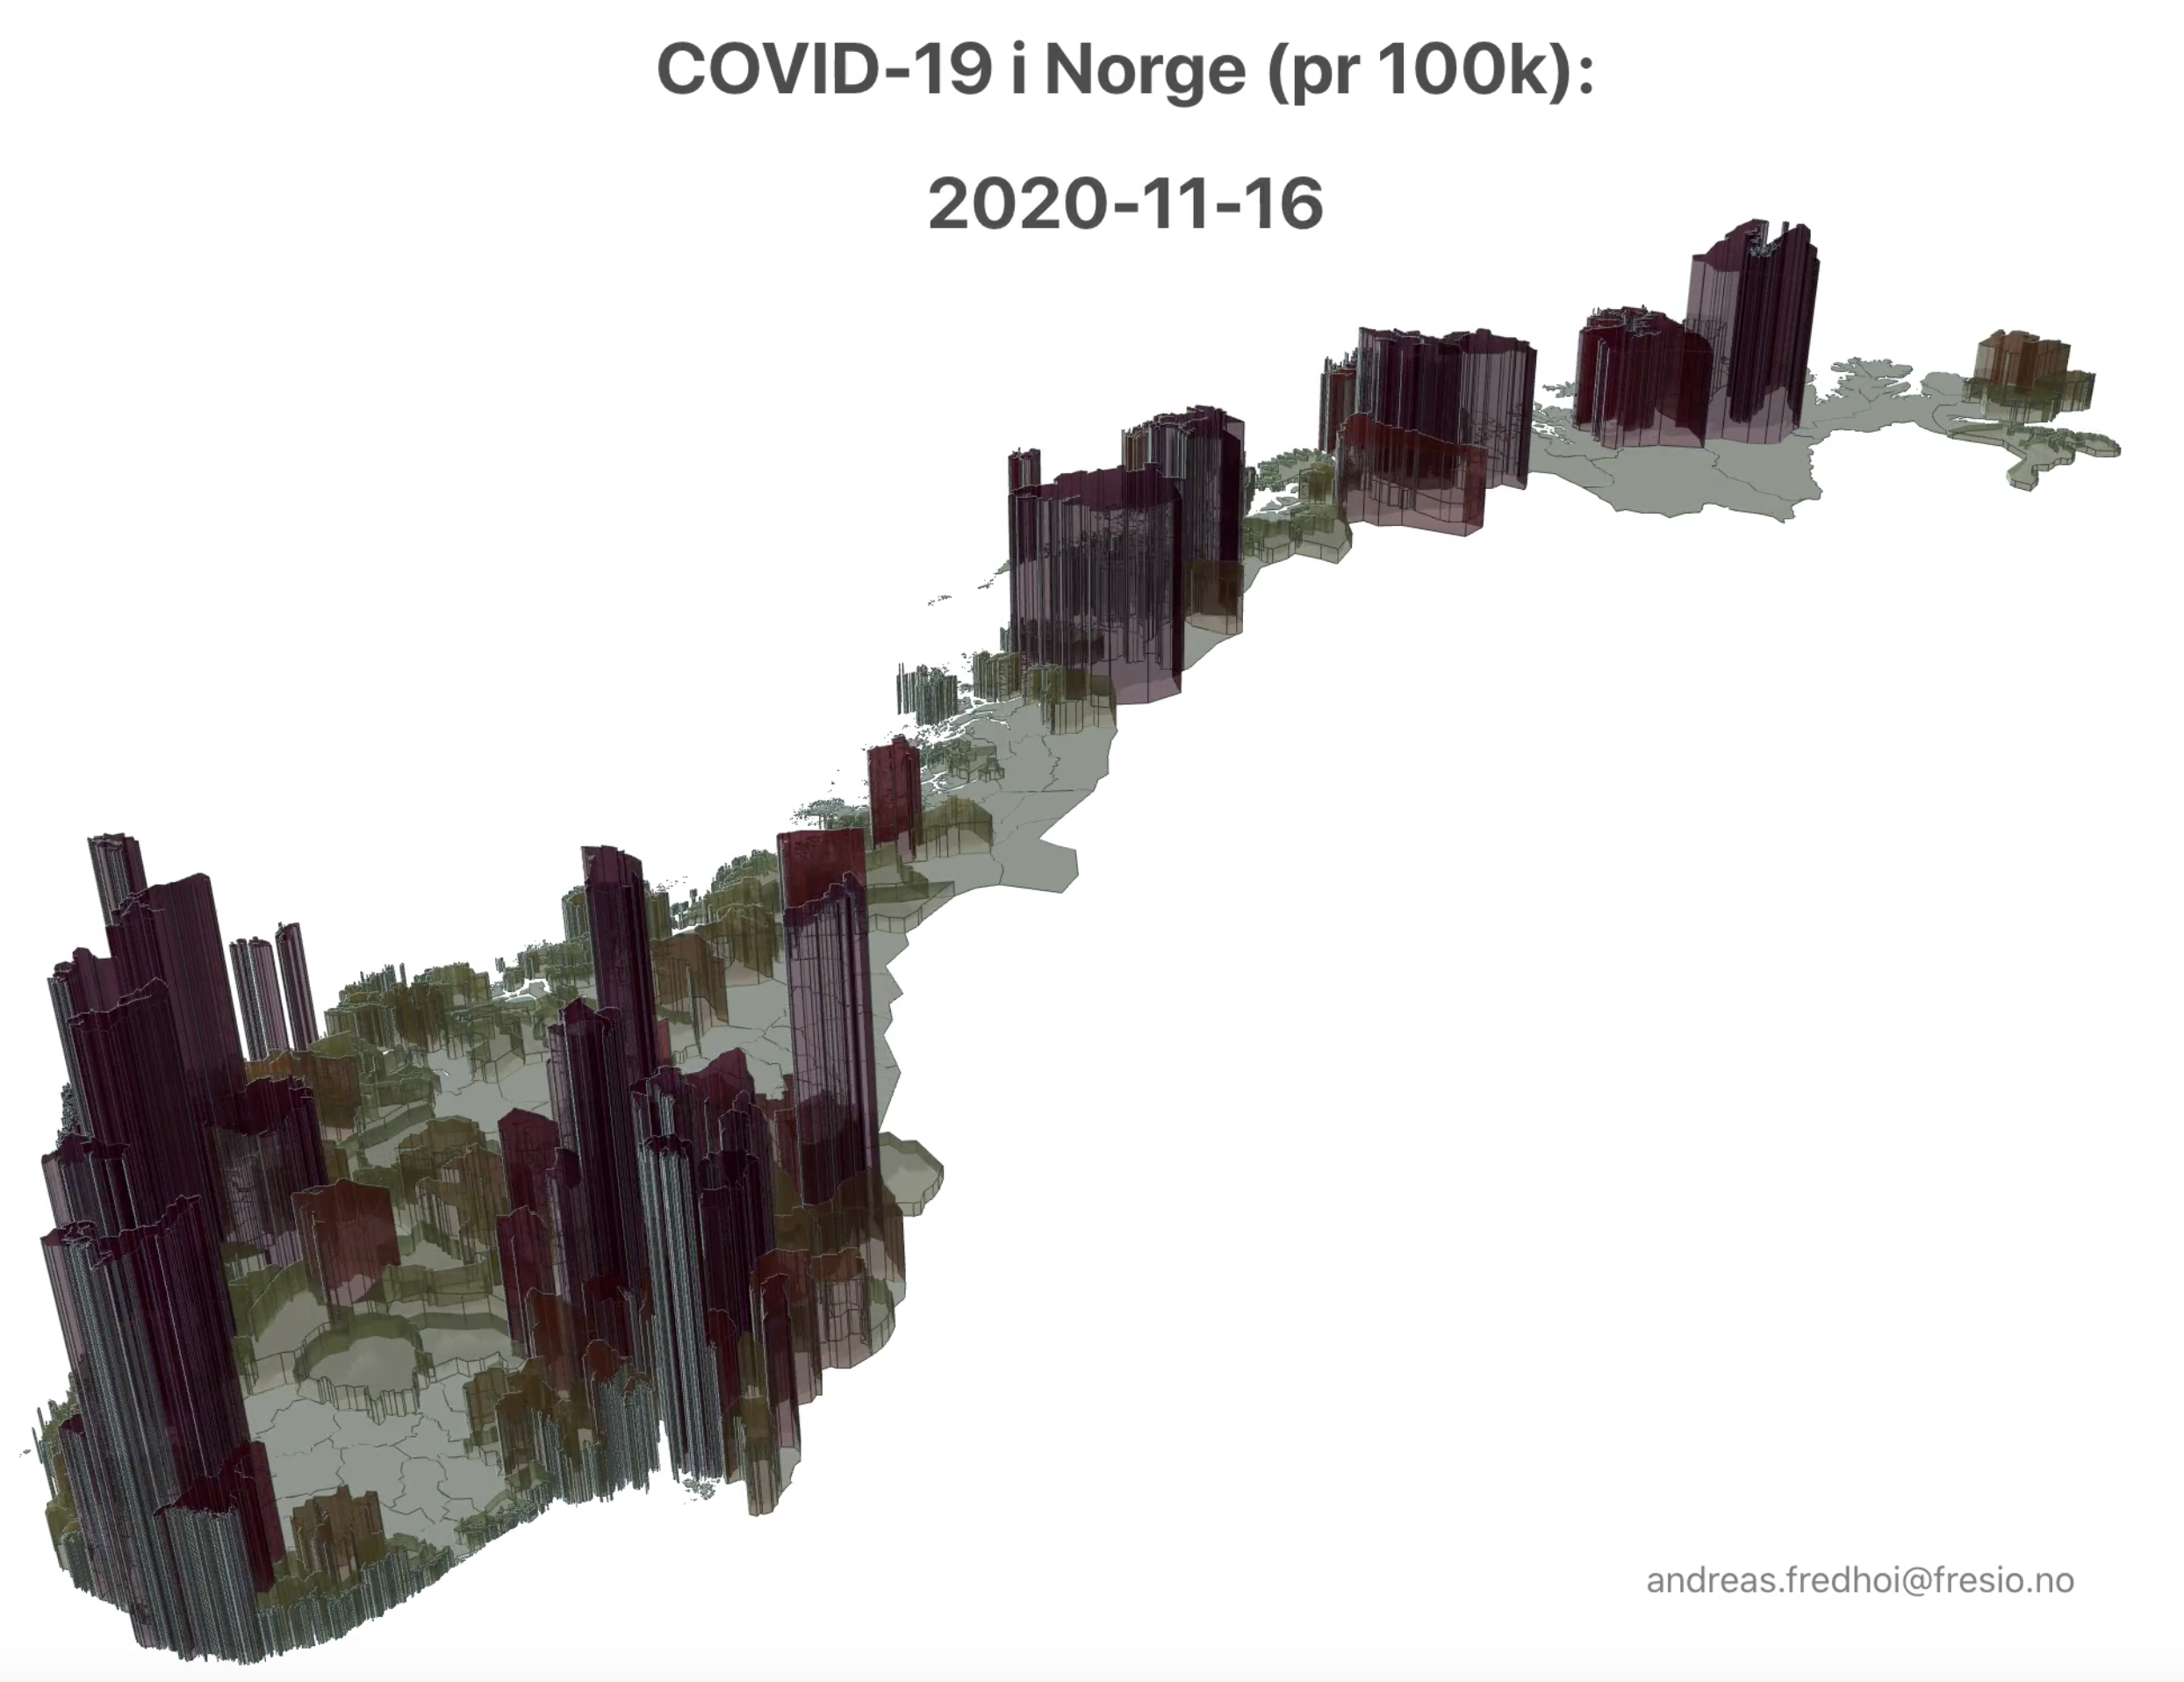
The viz is inspired by this reddit post on r/dataisbeautiful. Deck.gl/react has been used to create […]
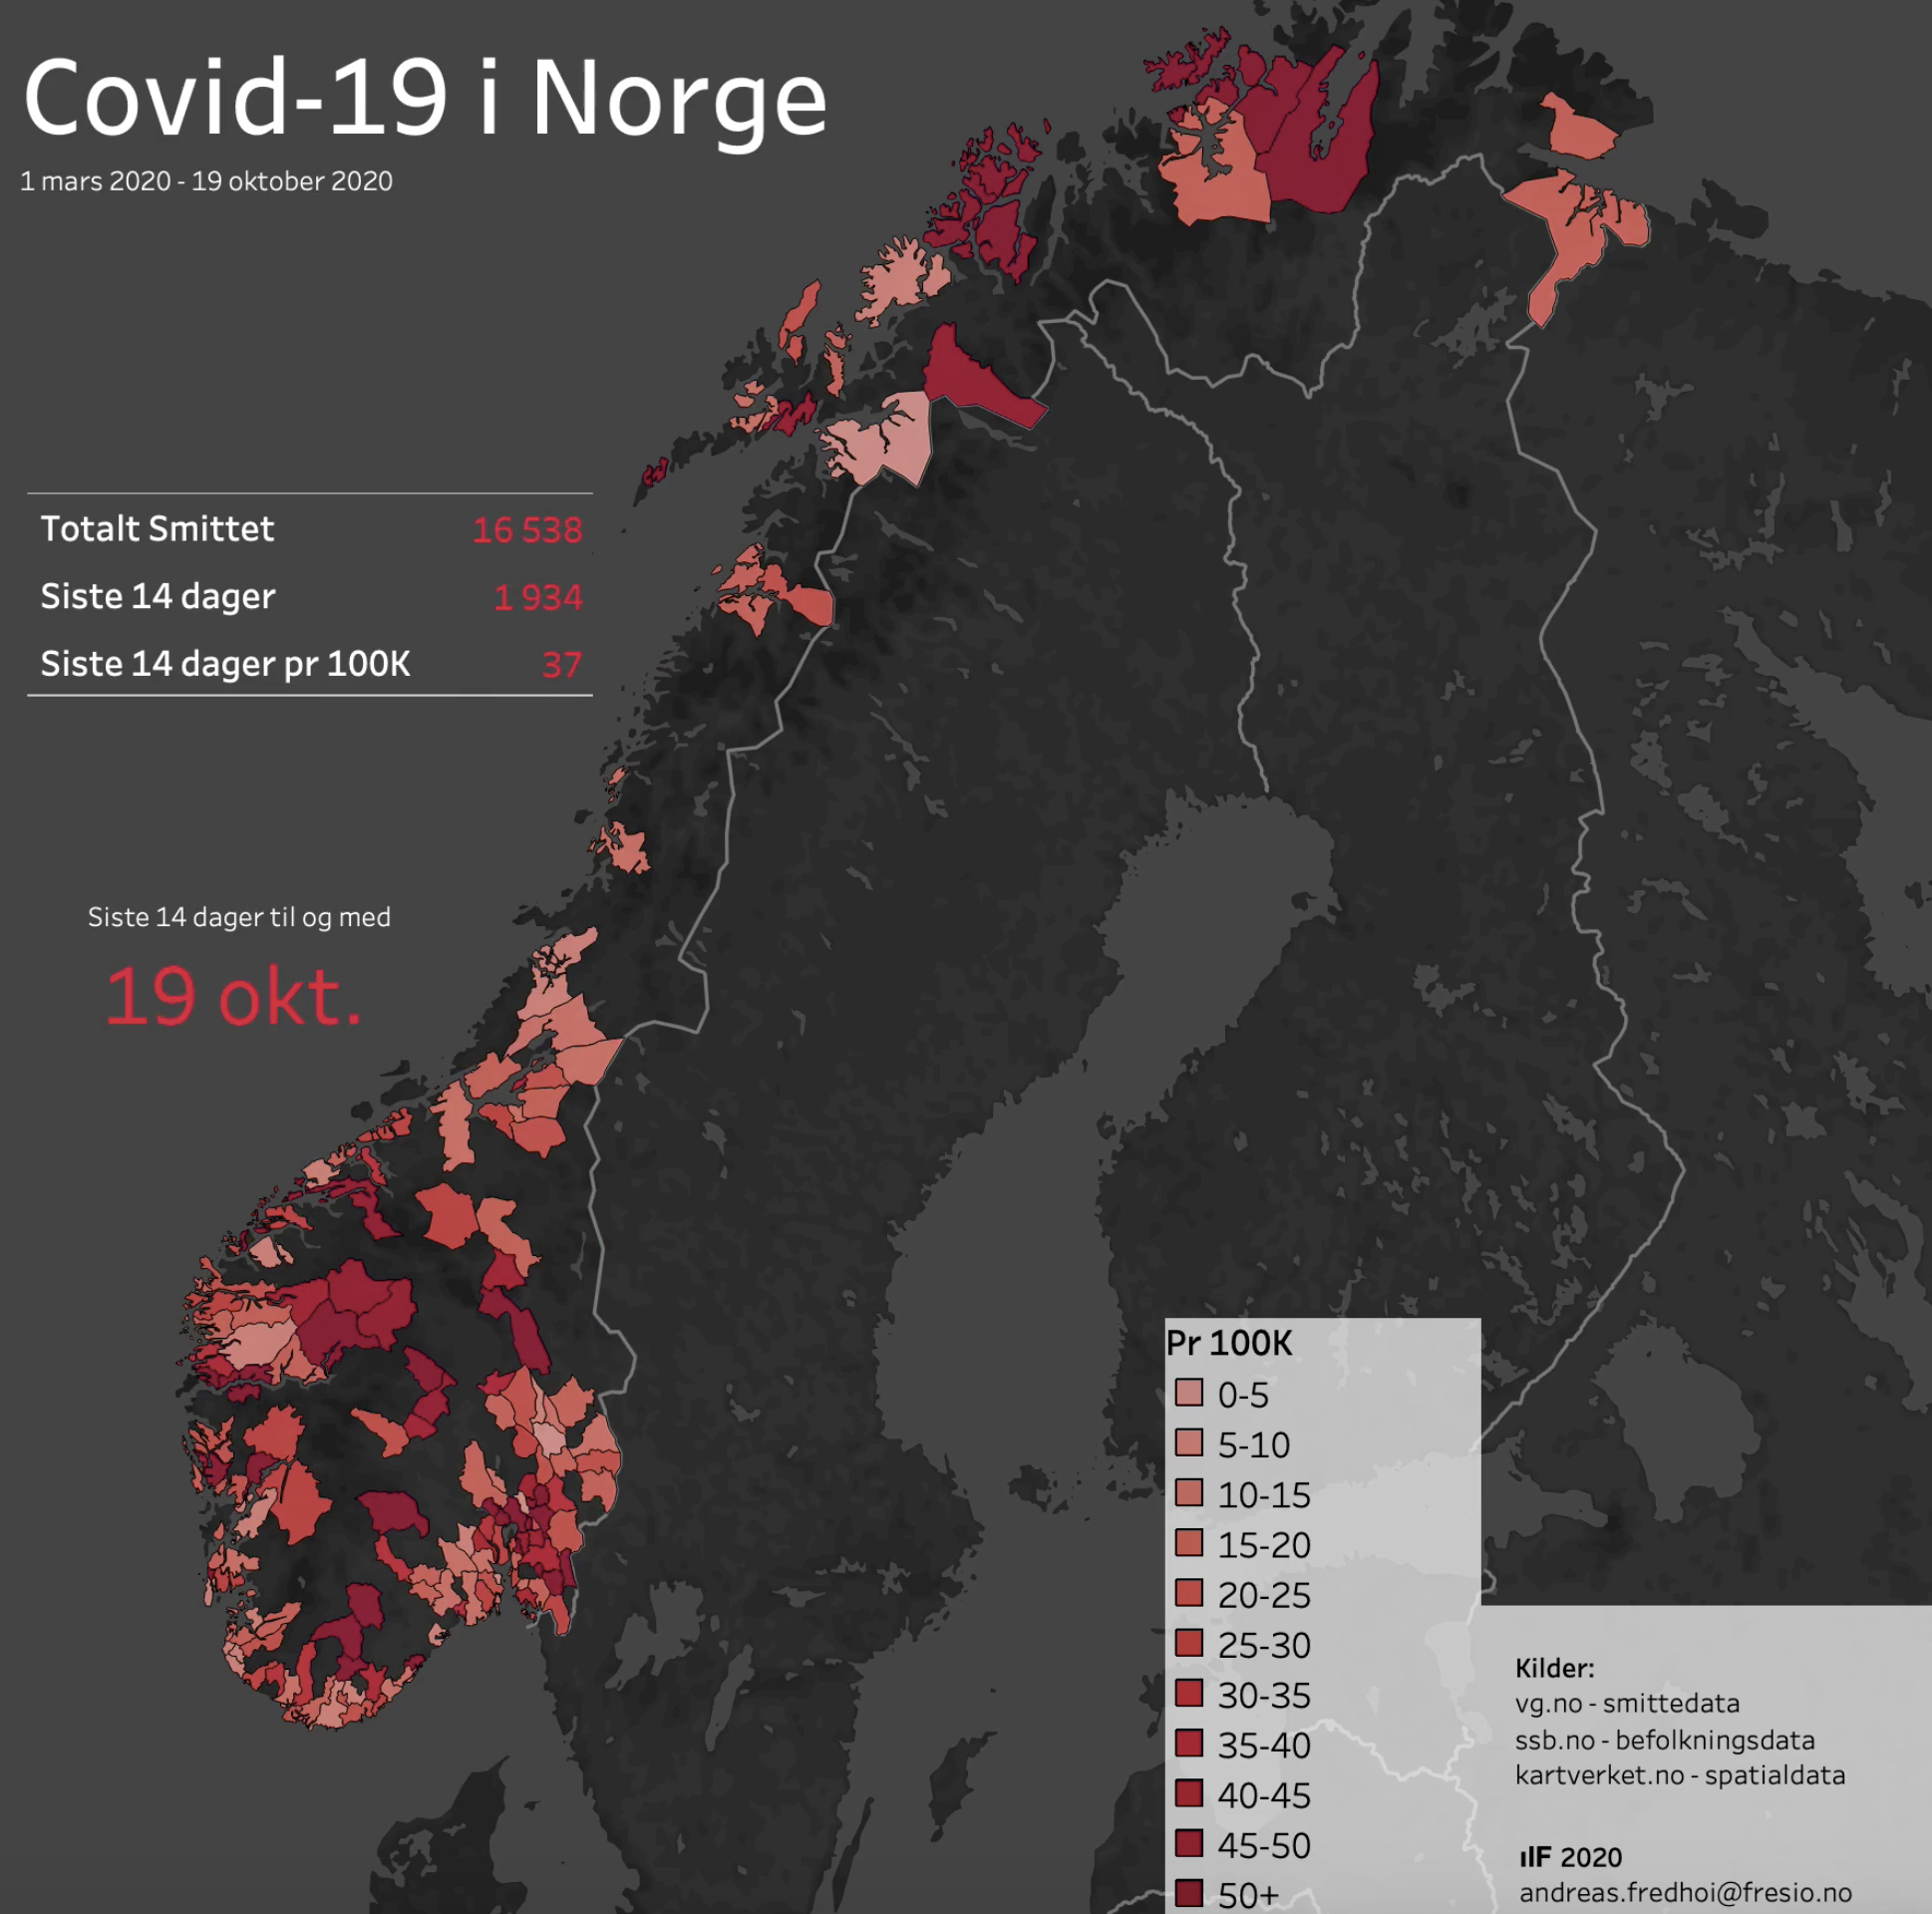
Building a simple overview of Covid 19 exposure in Norway over time Getting the data Infection […]
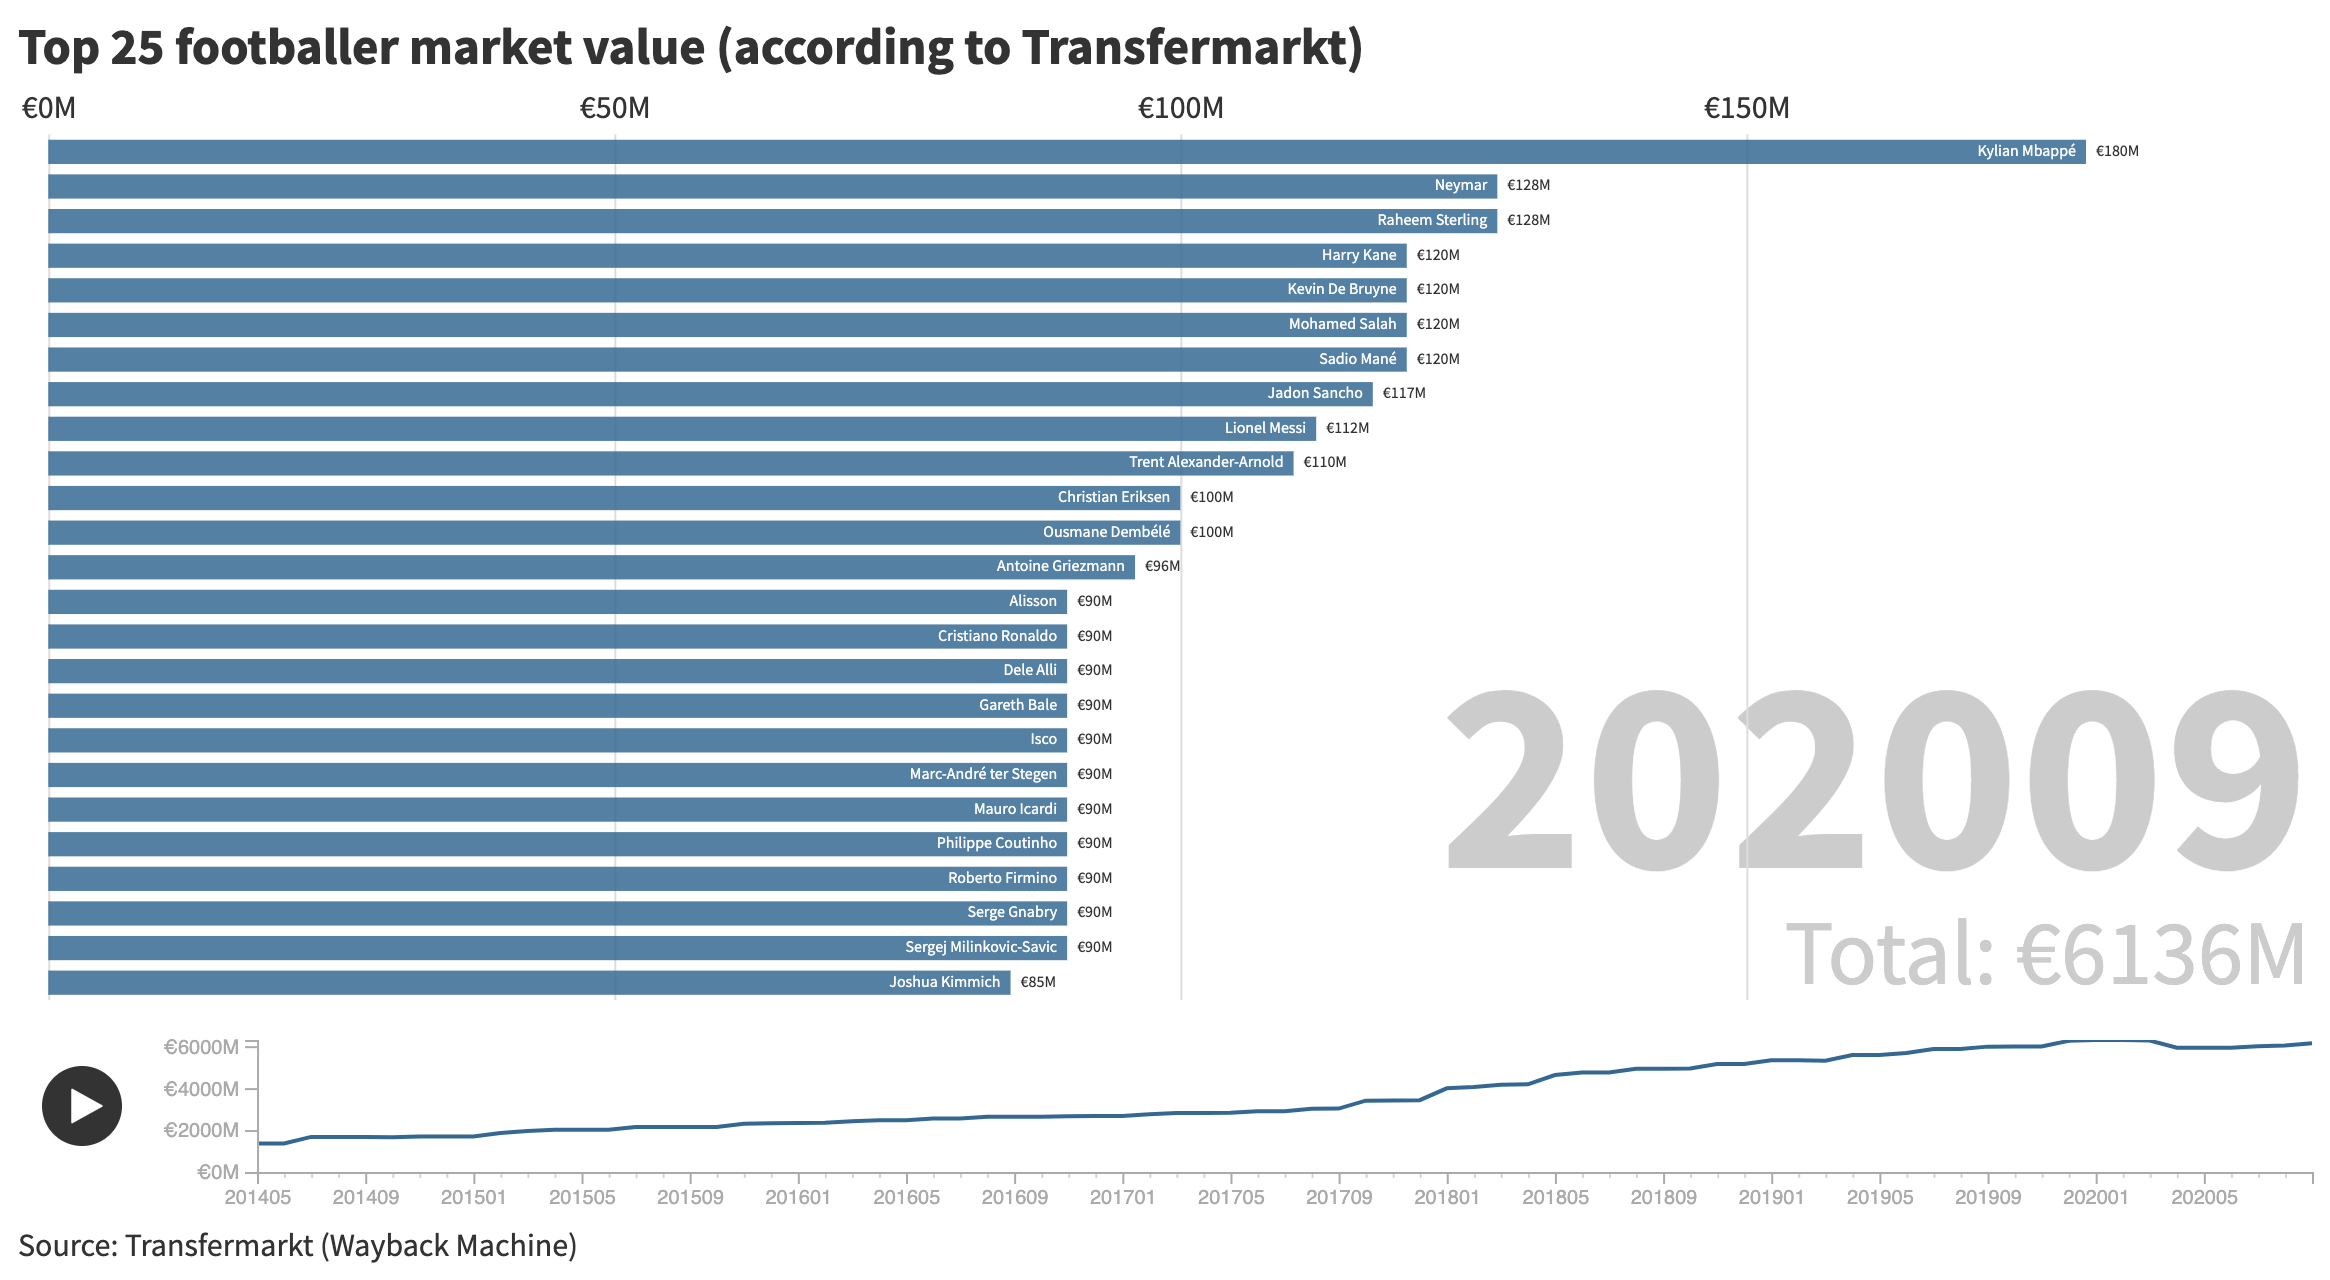
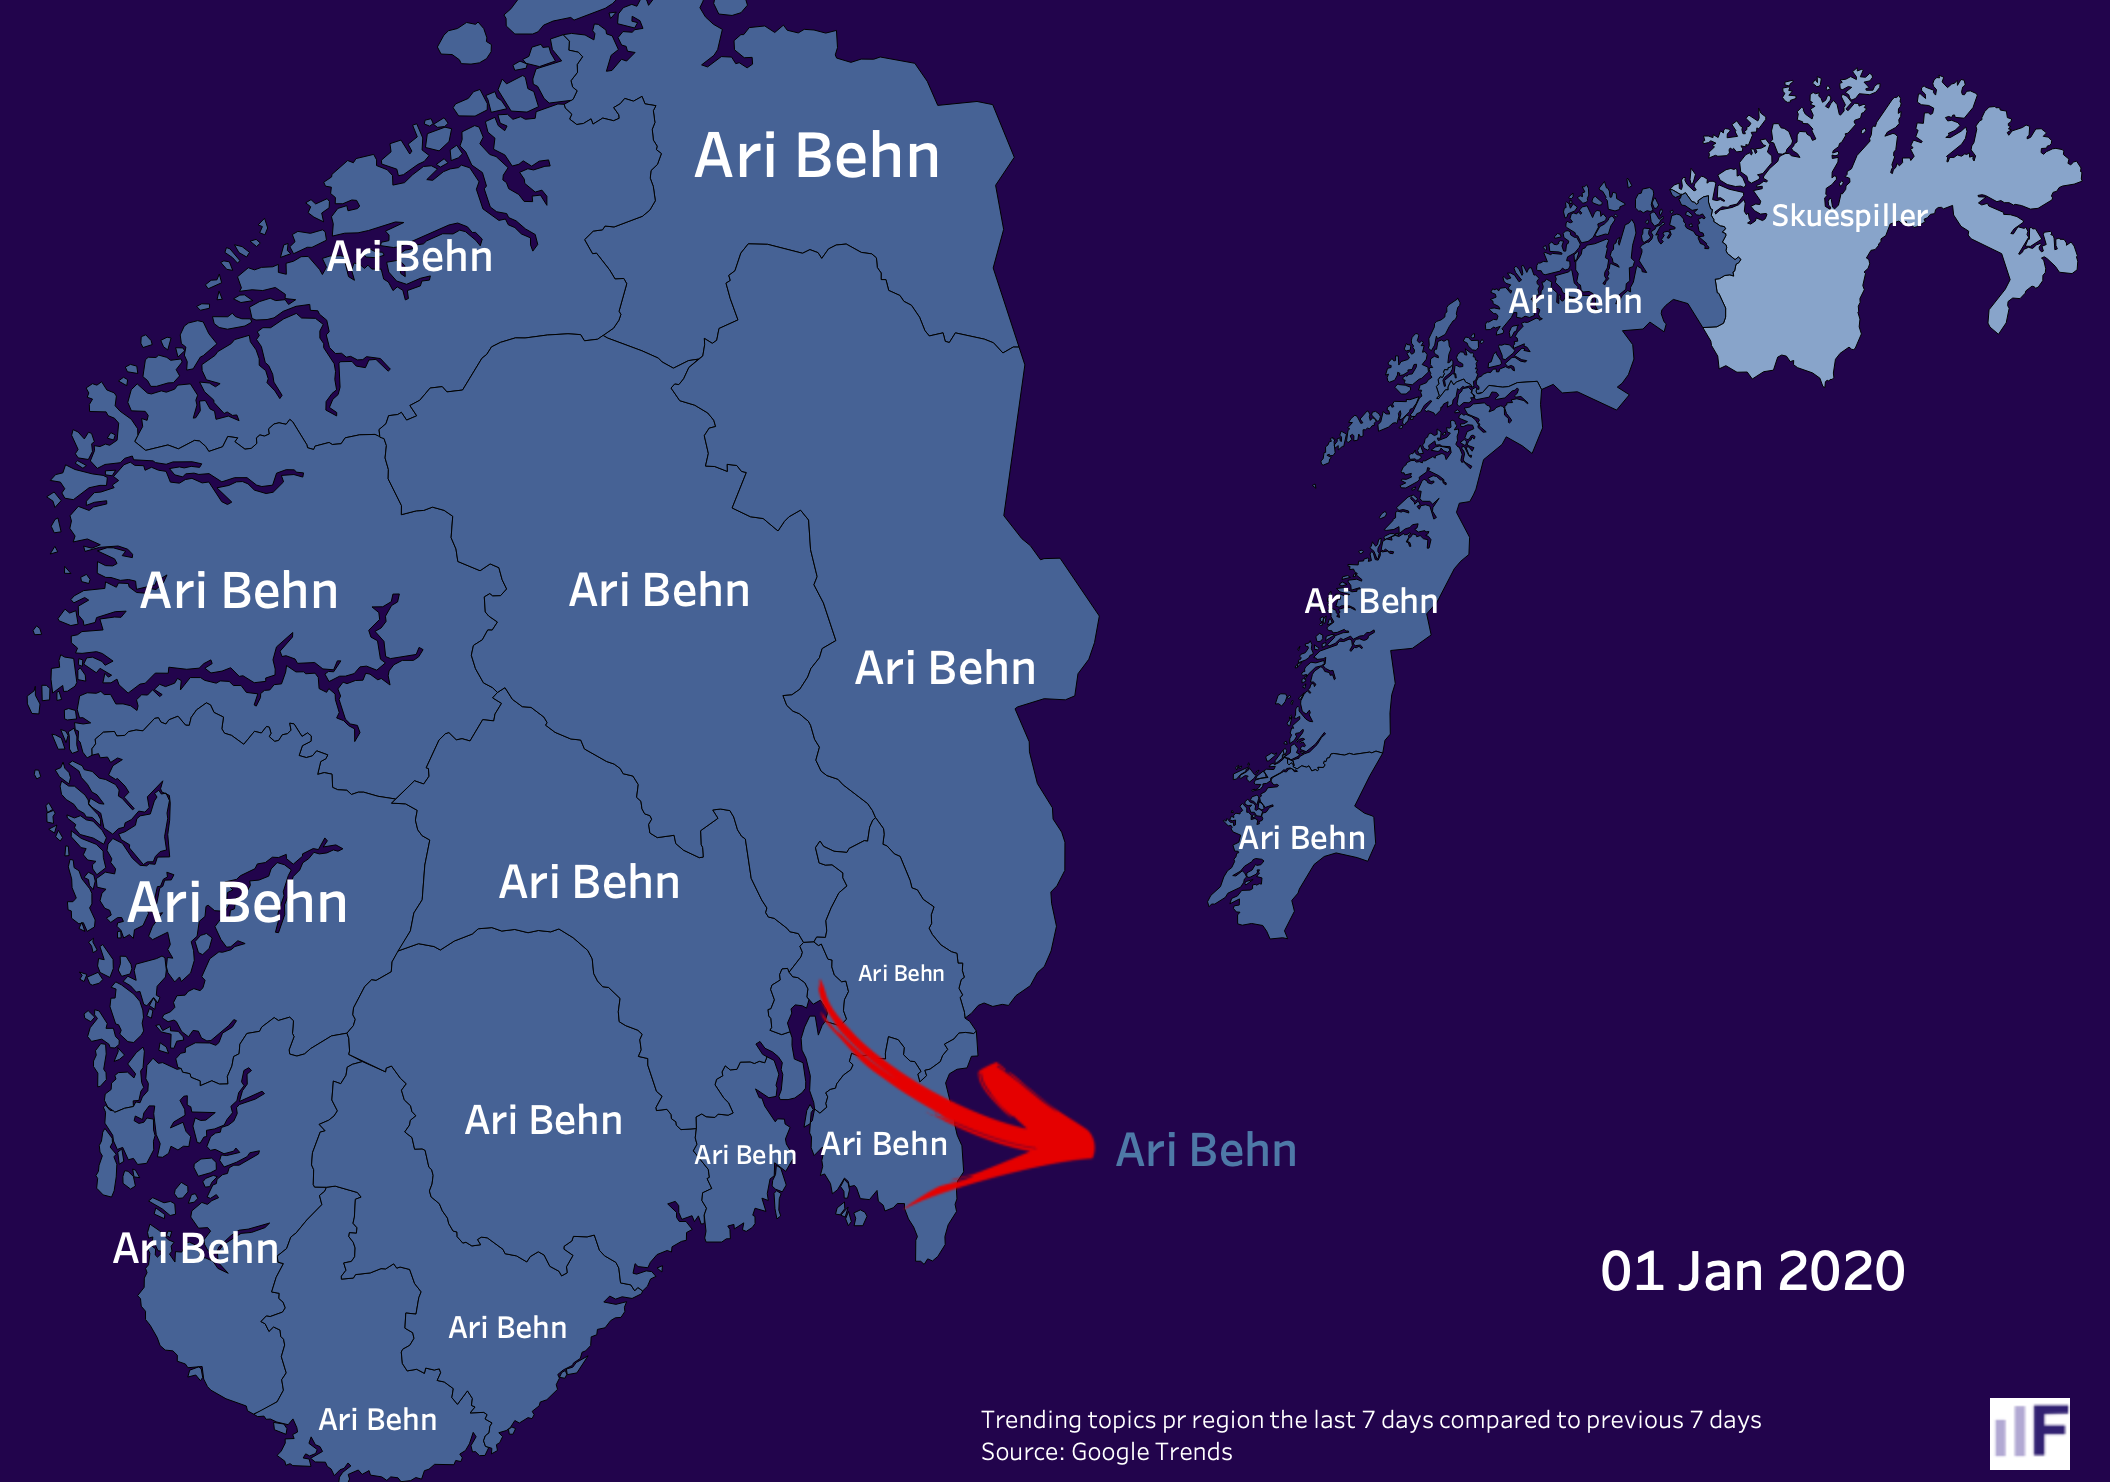
Here I had to go into Wayback Machine to grab historical overviews of the current top […]
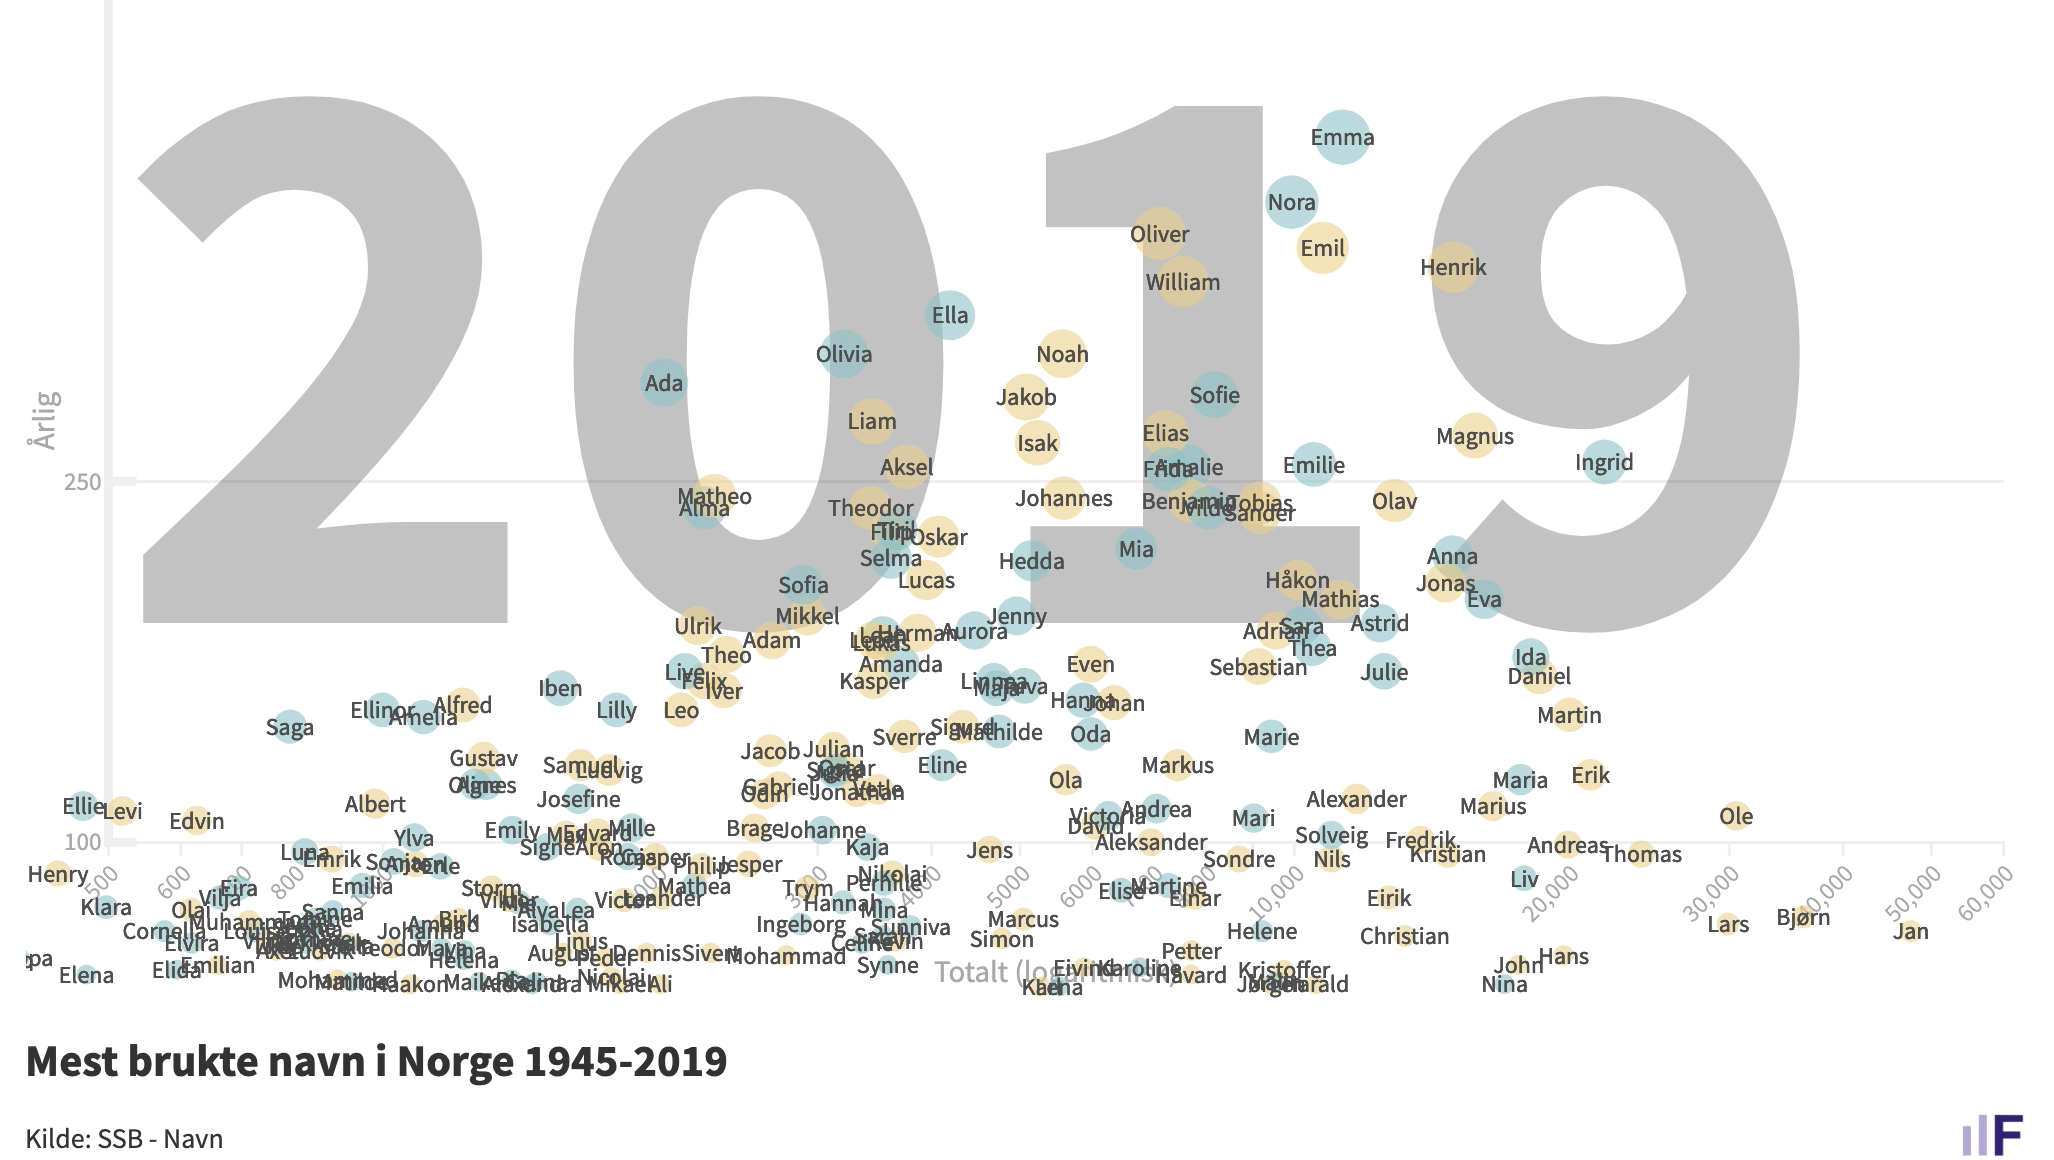
Built by grabbing and combining two csv files from SSB. Removed low scoring names to reduce […]
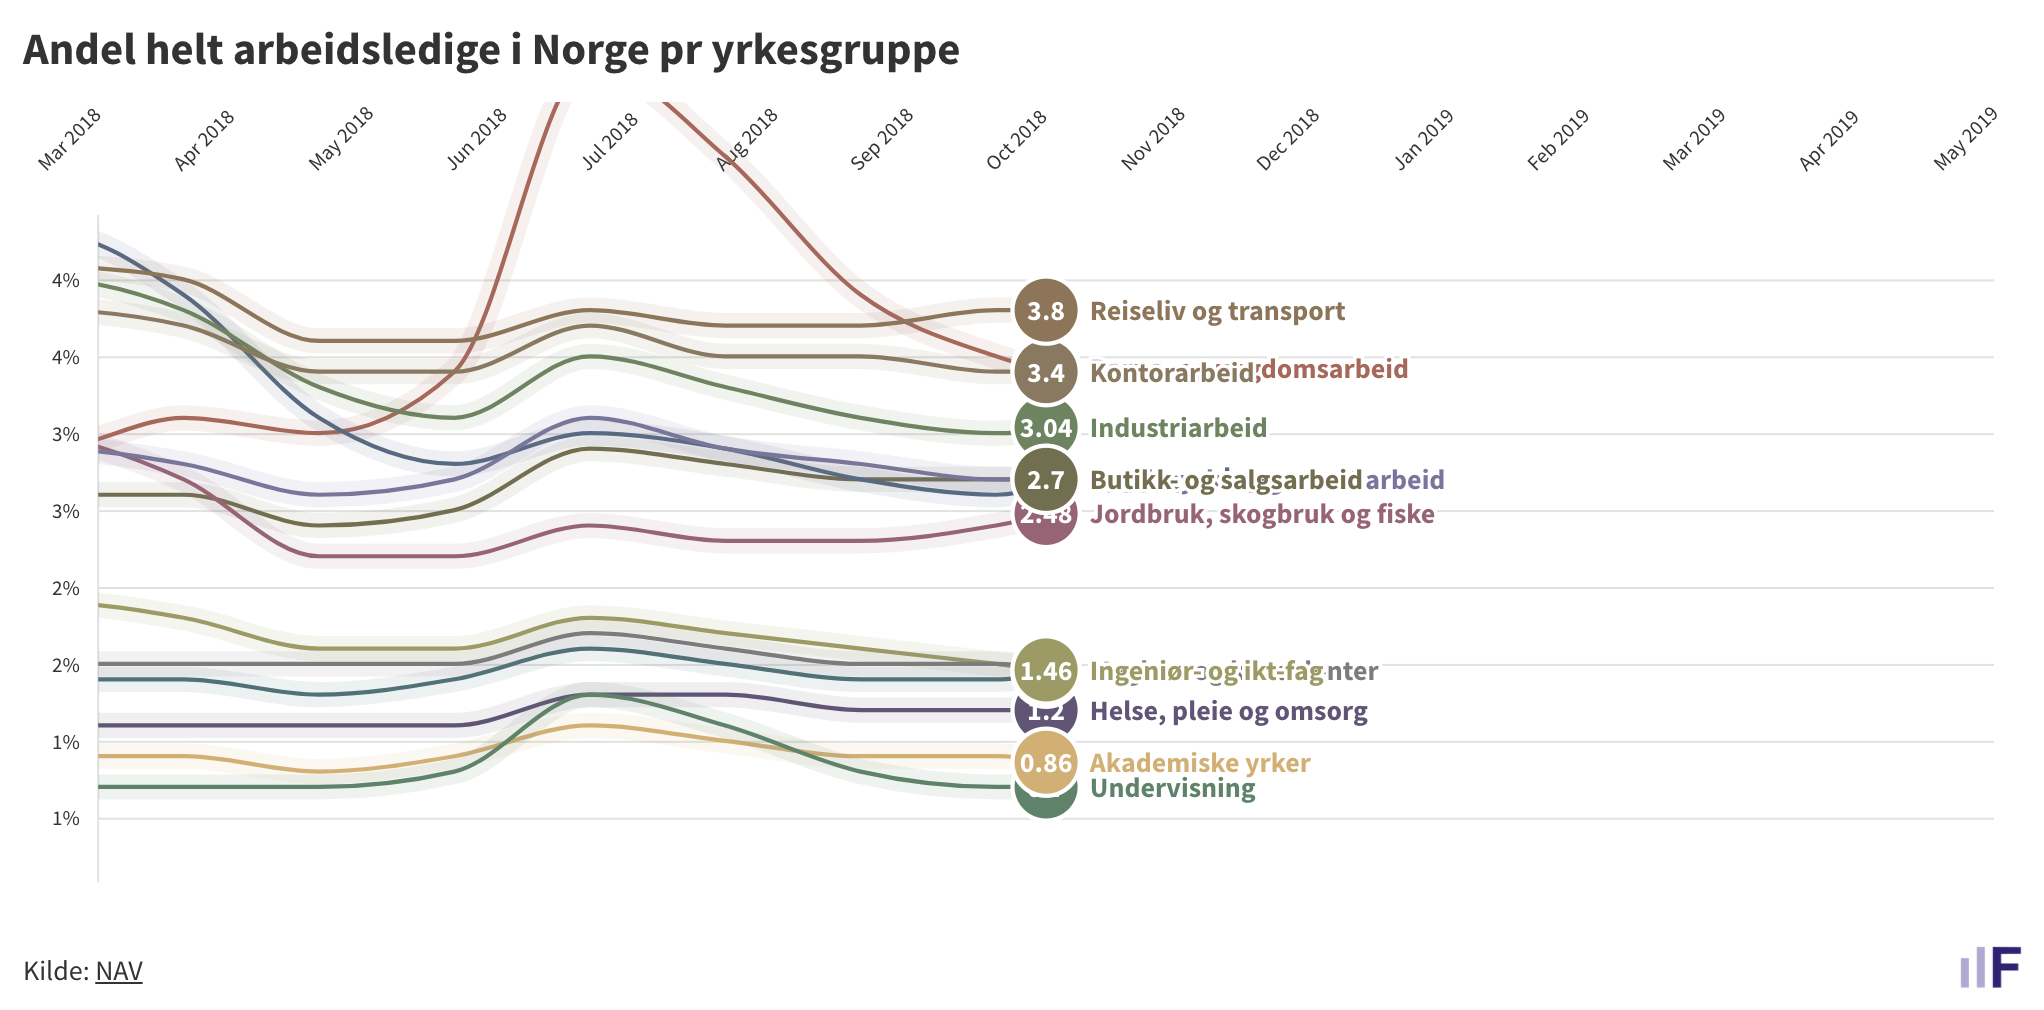
A quick viz set up in Flourish by downloading data from NAV. The data was manually […]
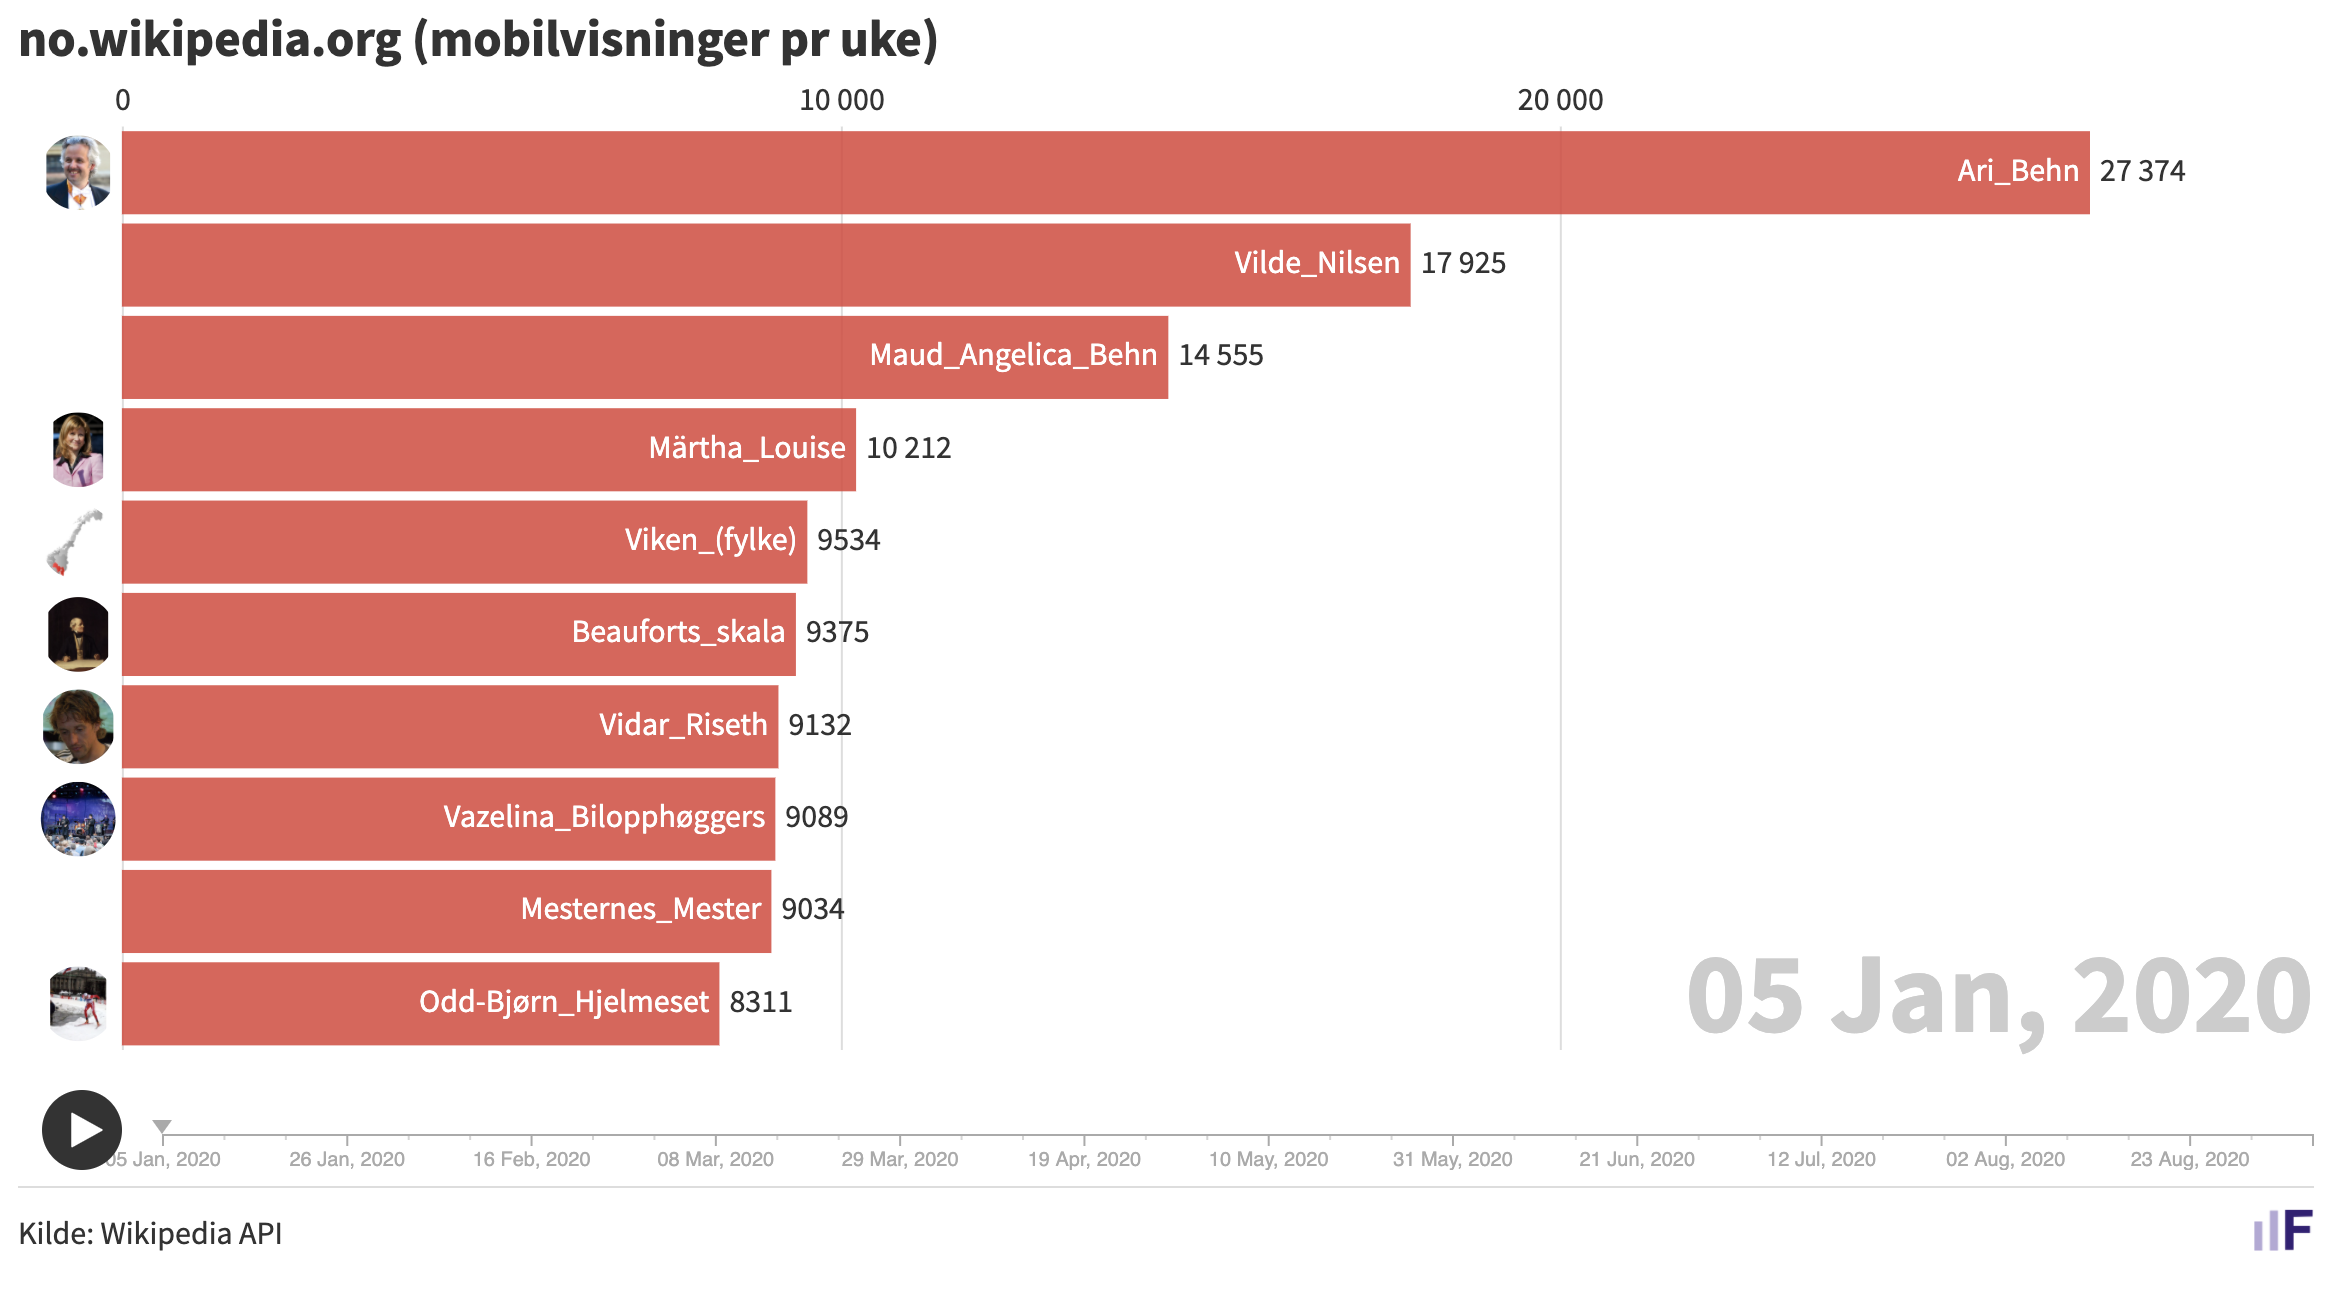
Time to look at some insights the Wikipedia API can offer. This view shows top mobile […]
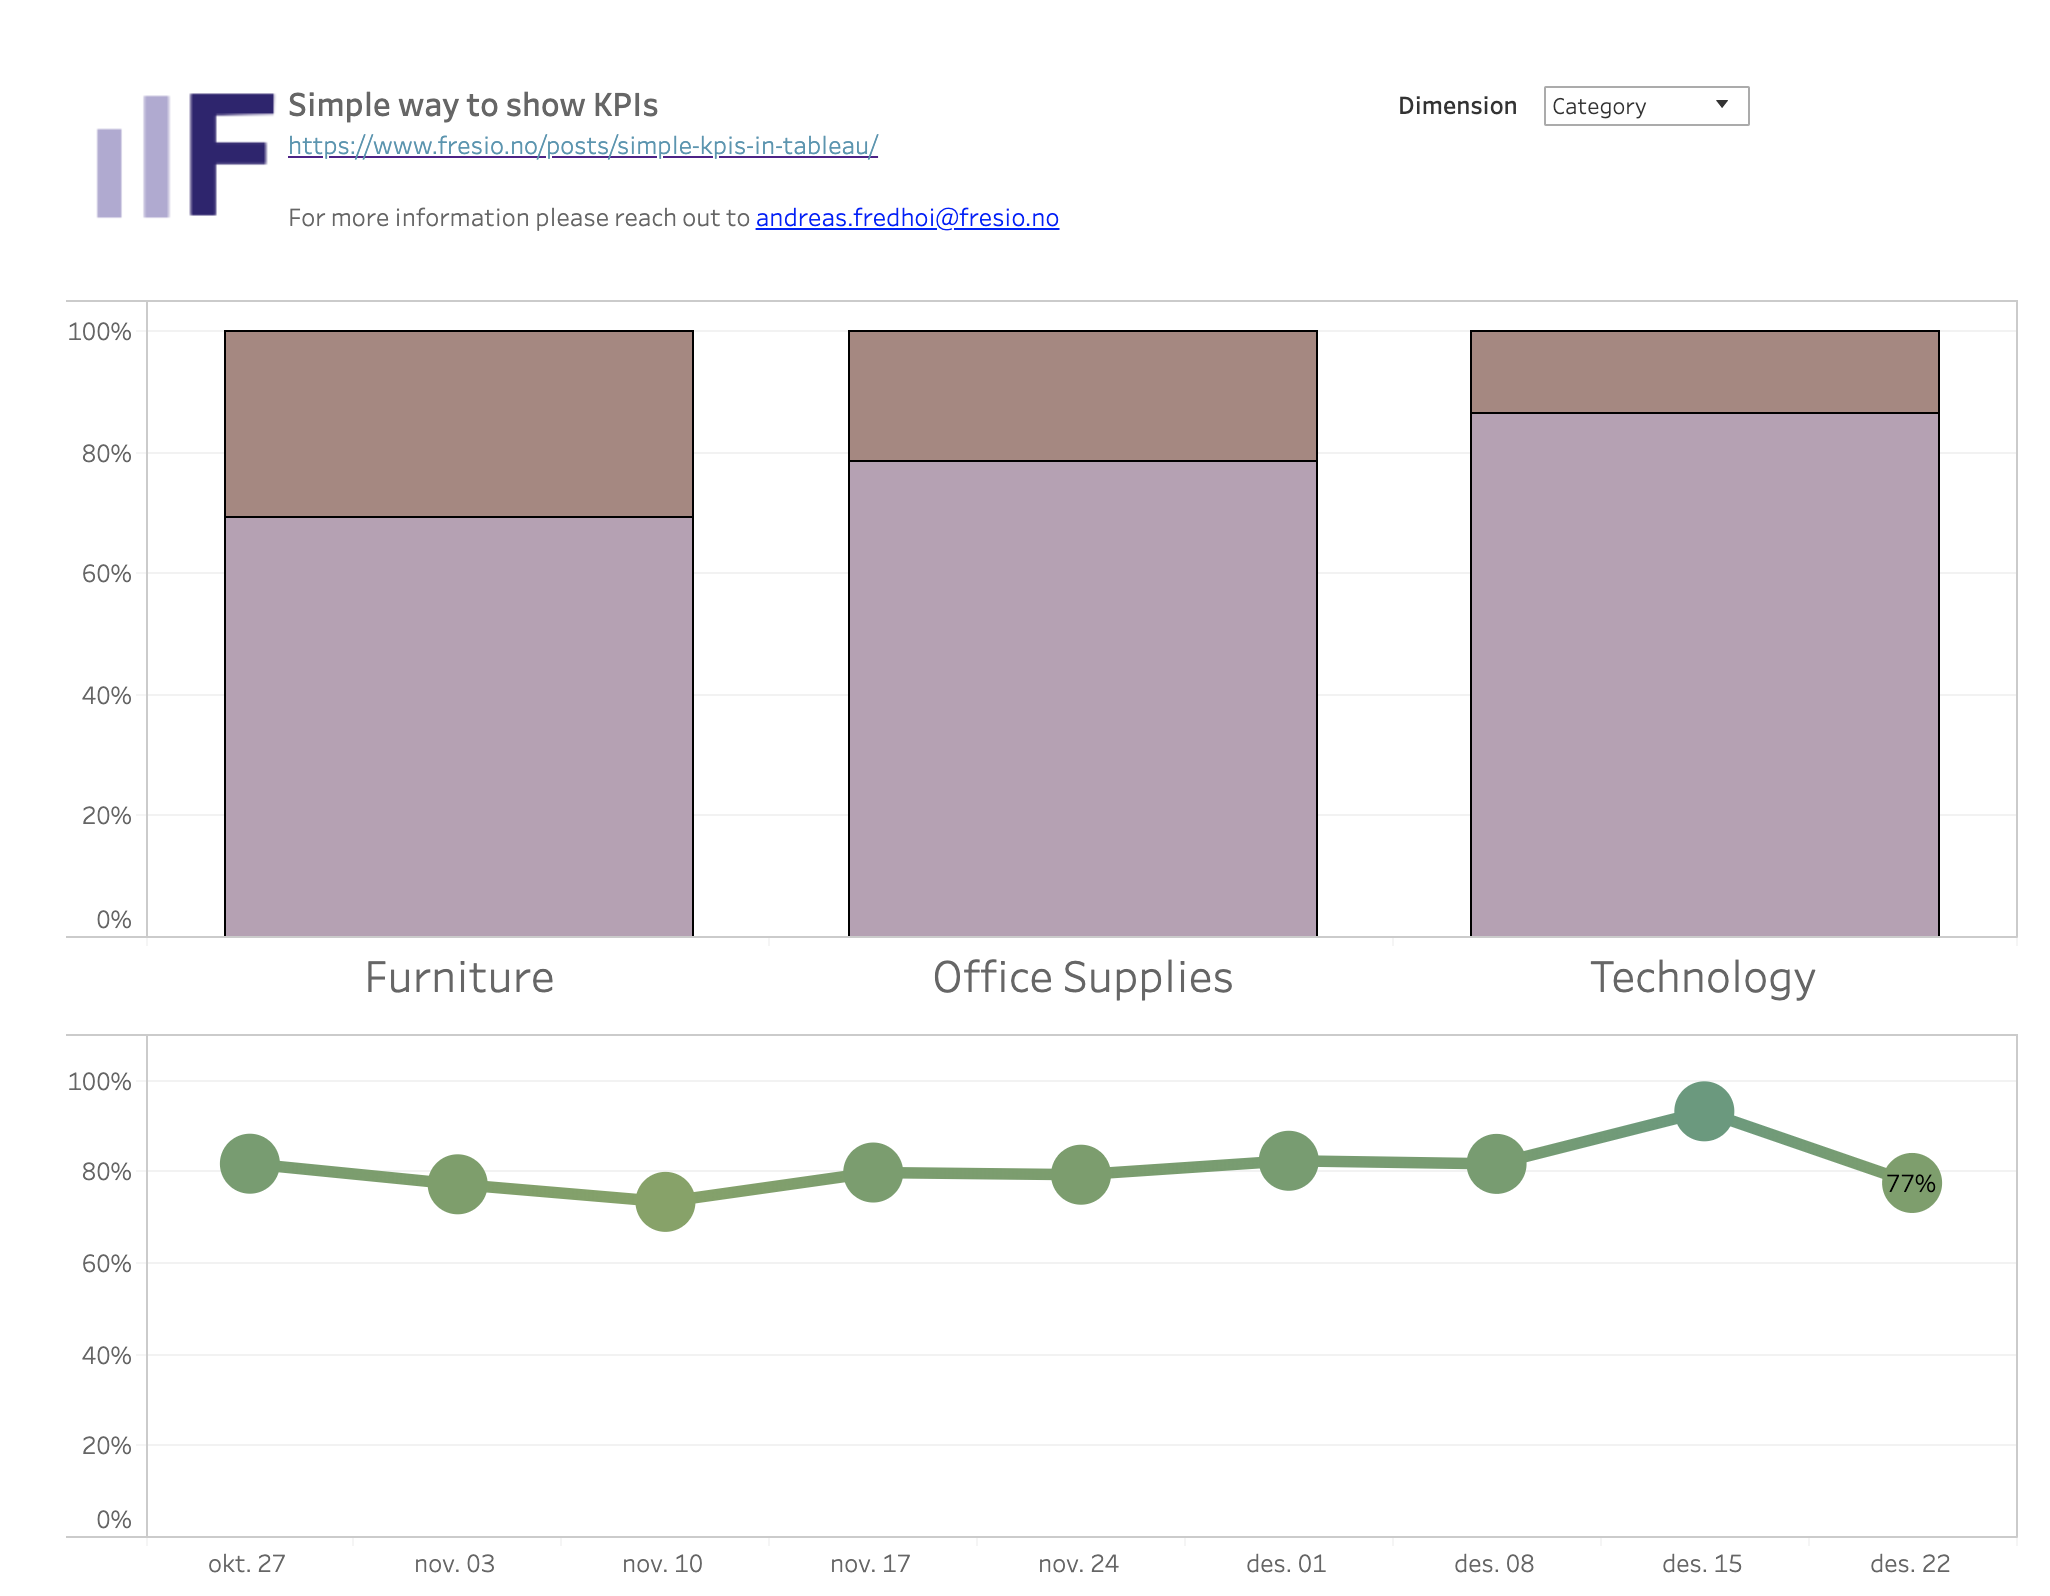
In this dashboard I will show you a simple way of creating KPIs including trend lines. […]
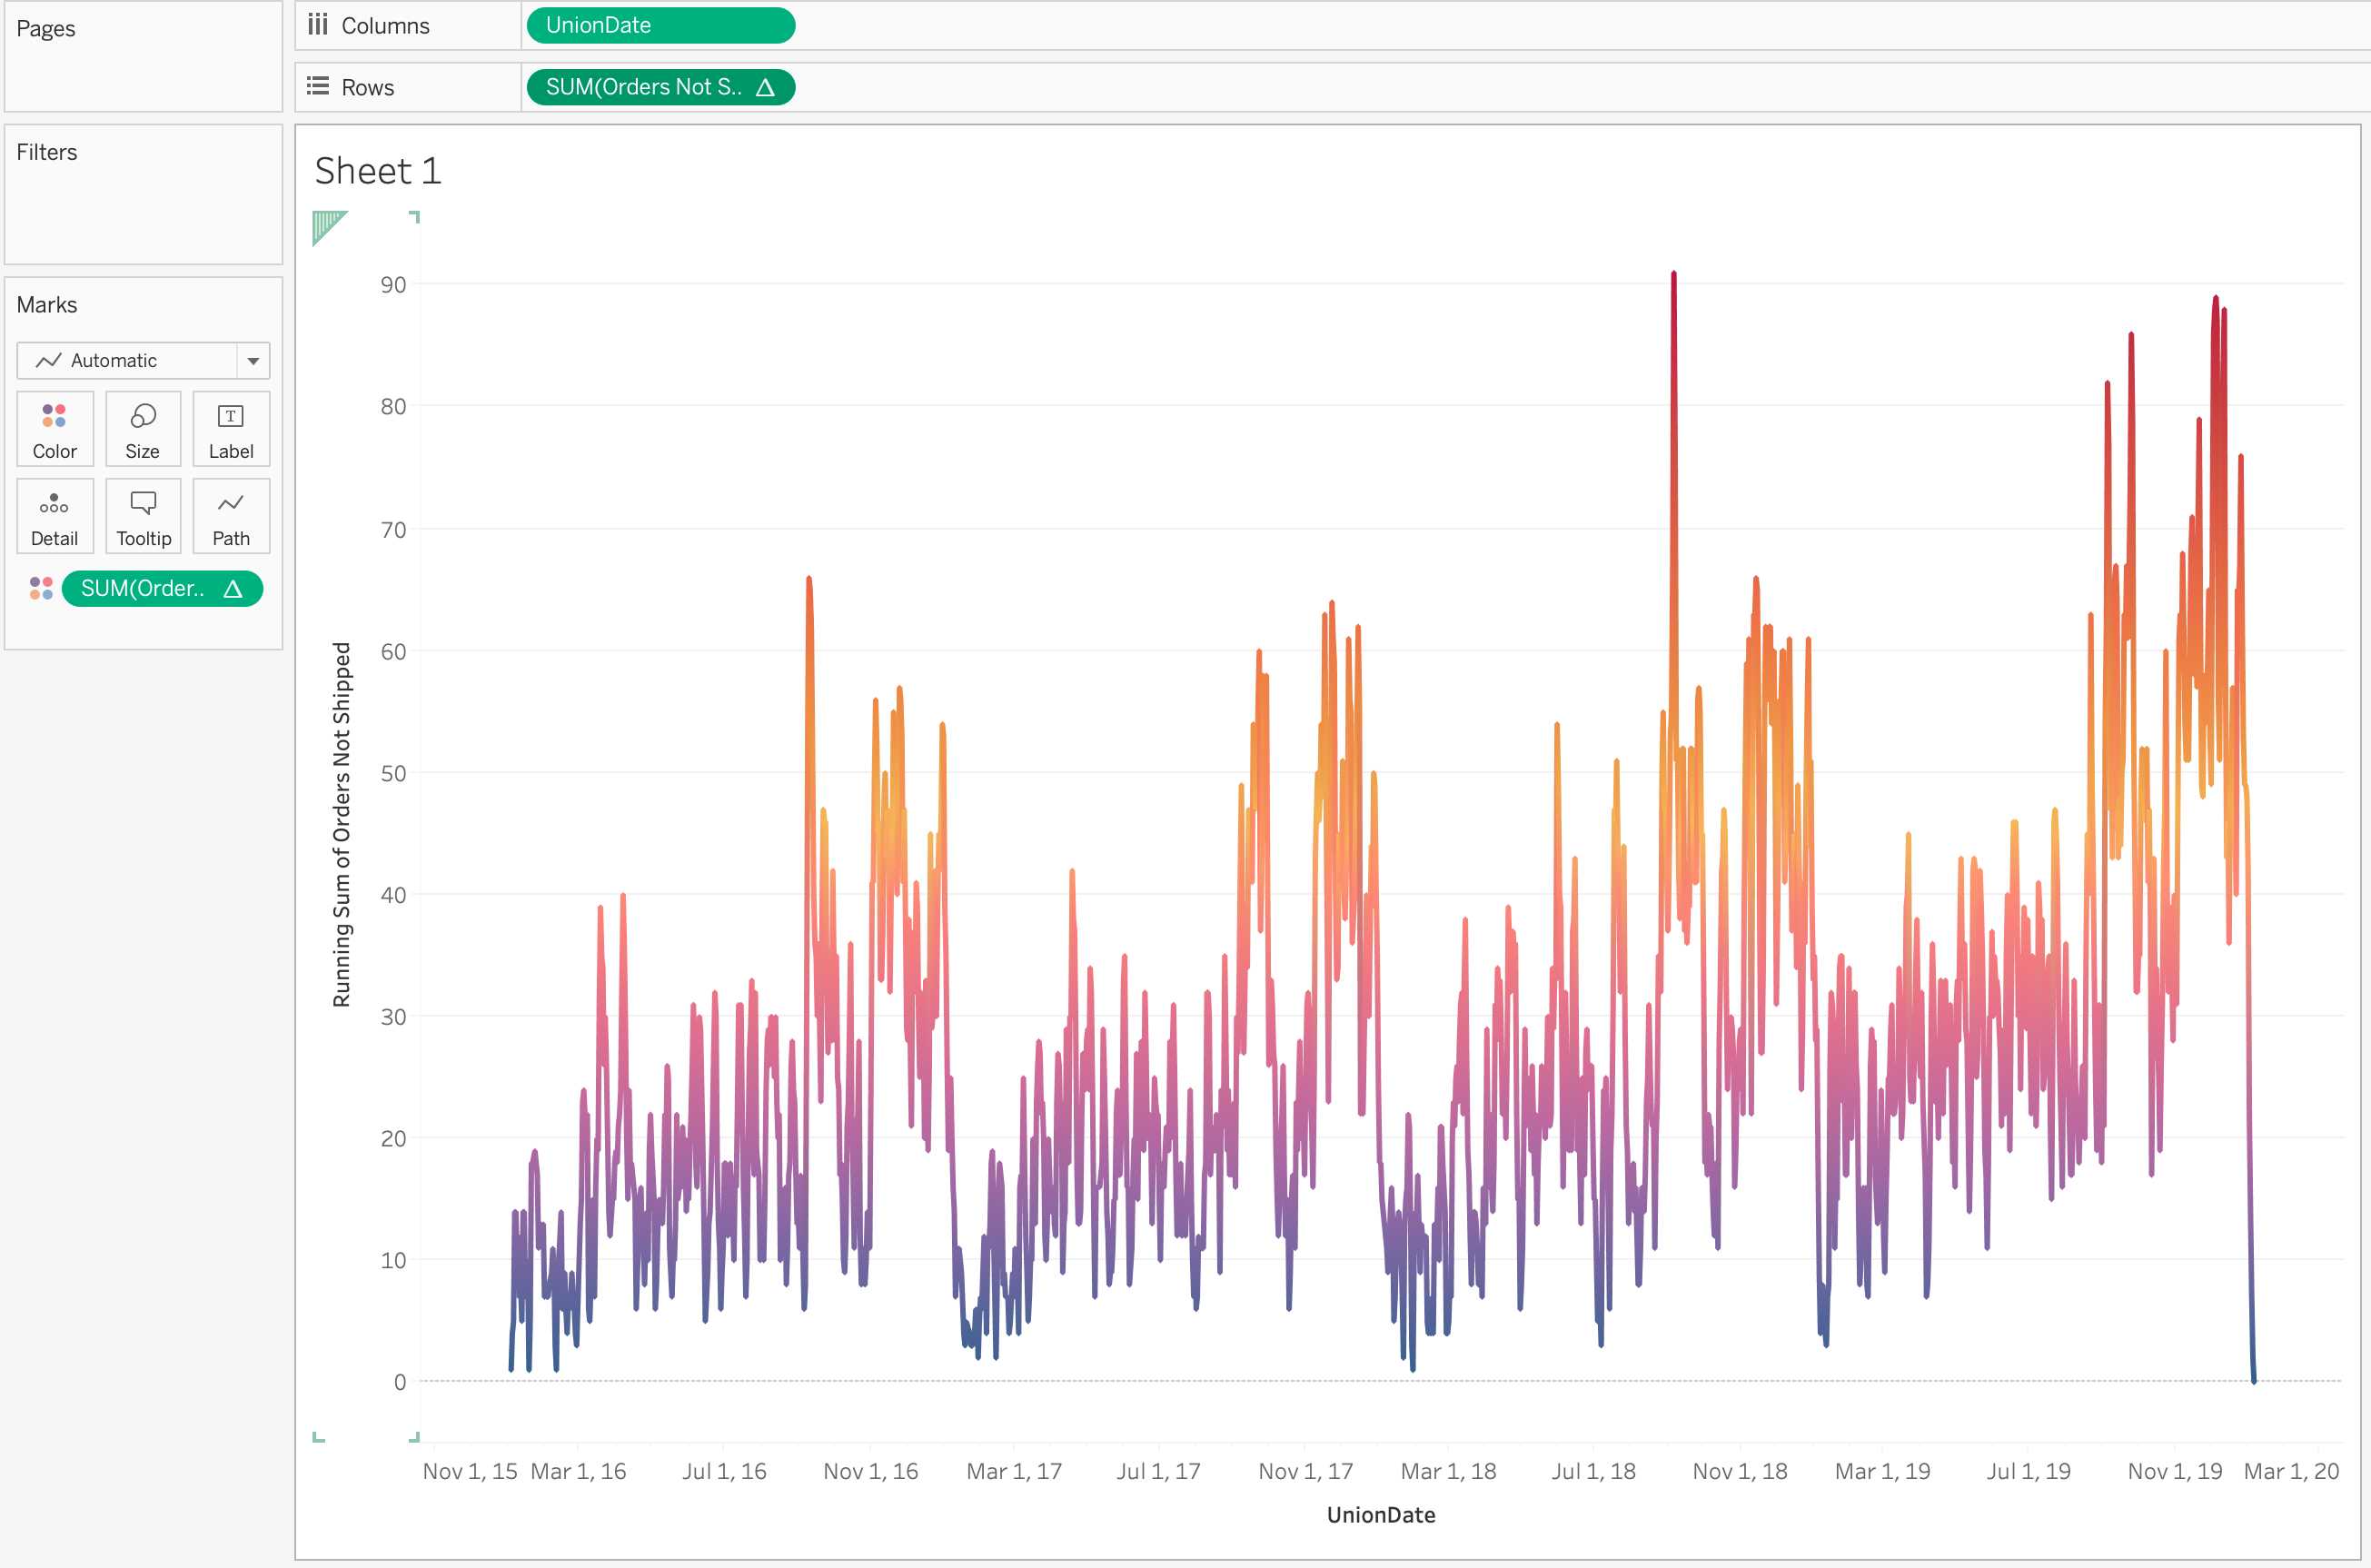
A common use case when looking at log files or data for ticket requests is to […]