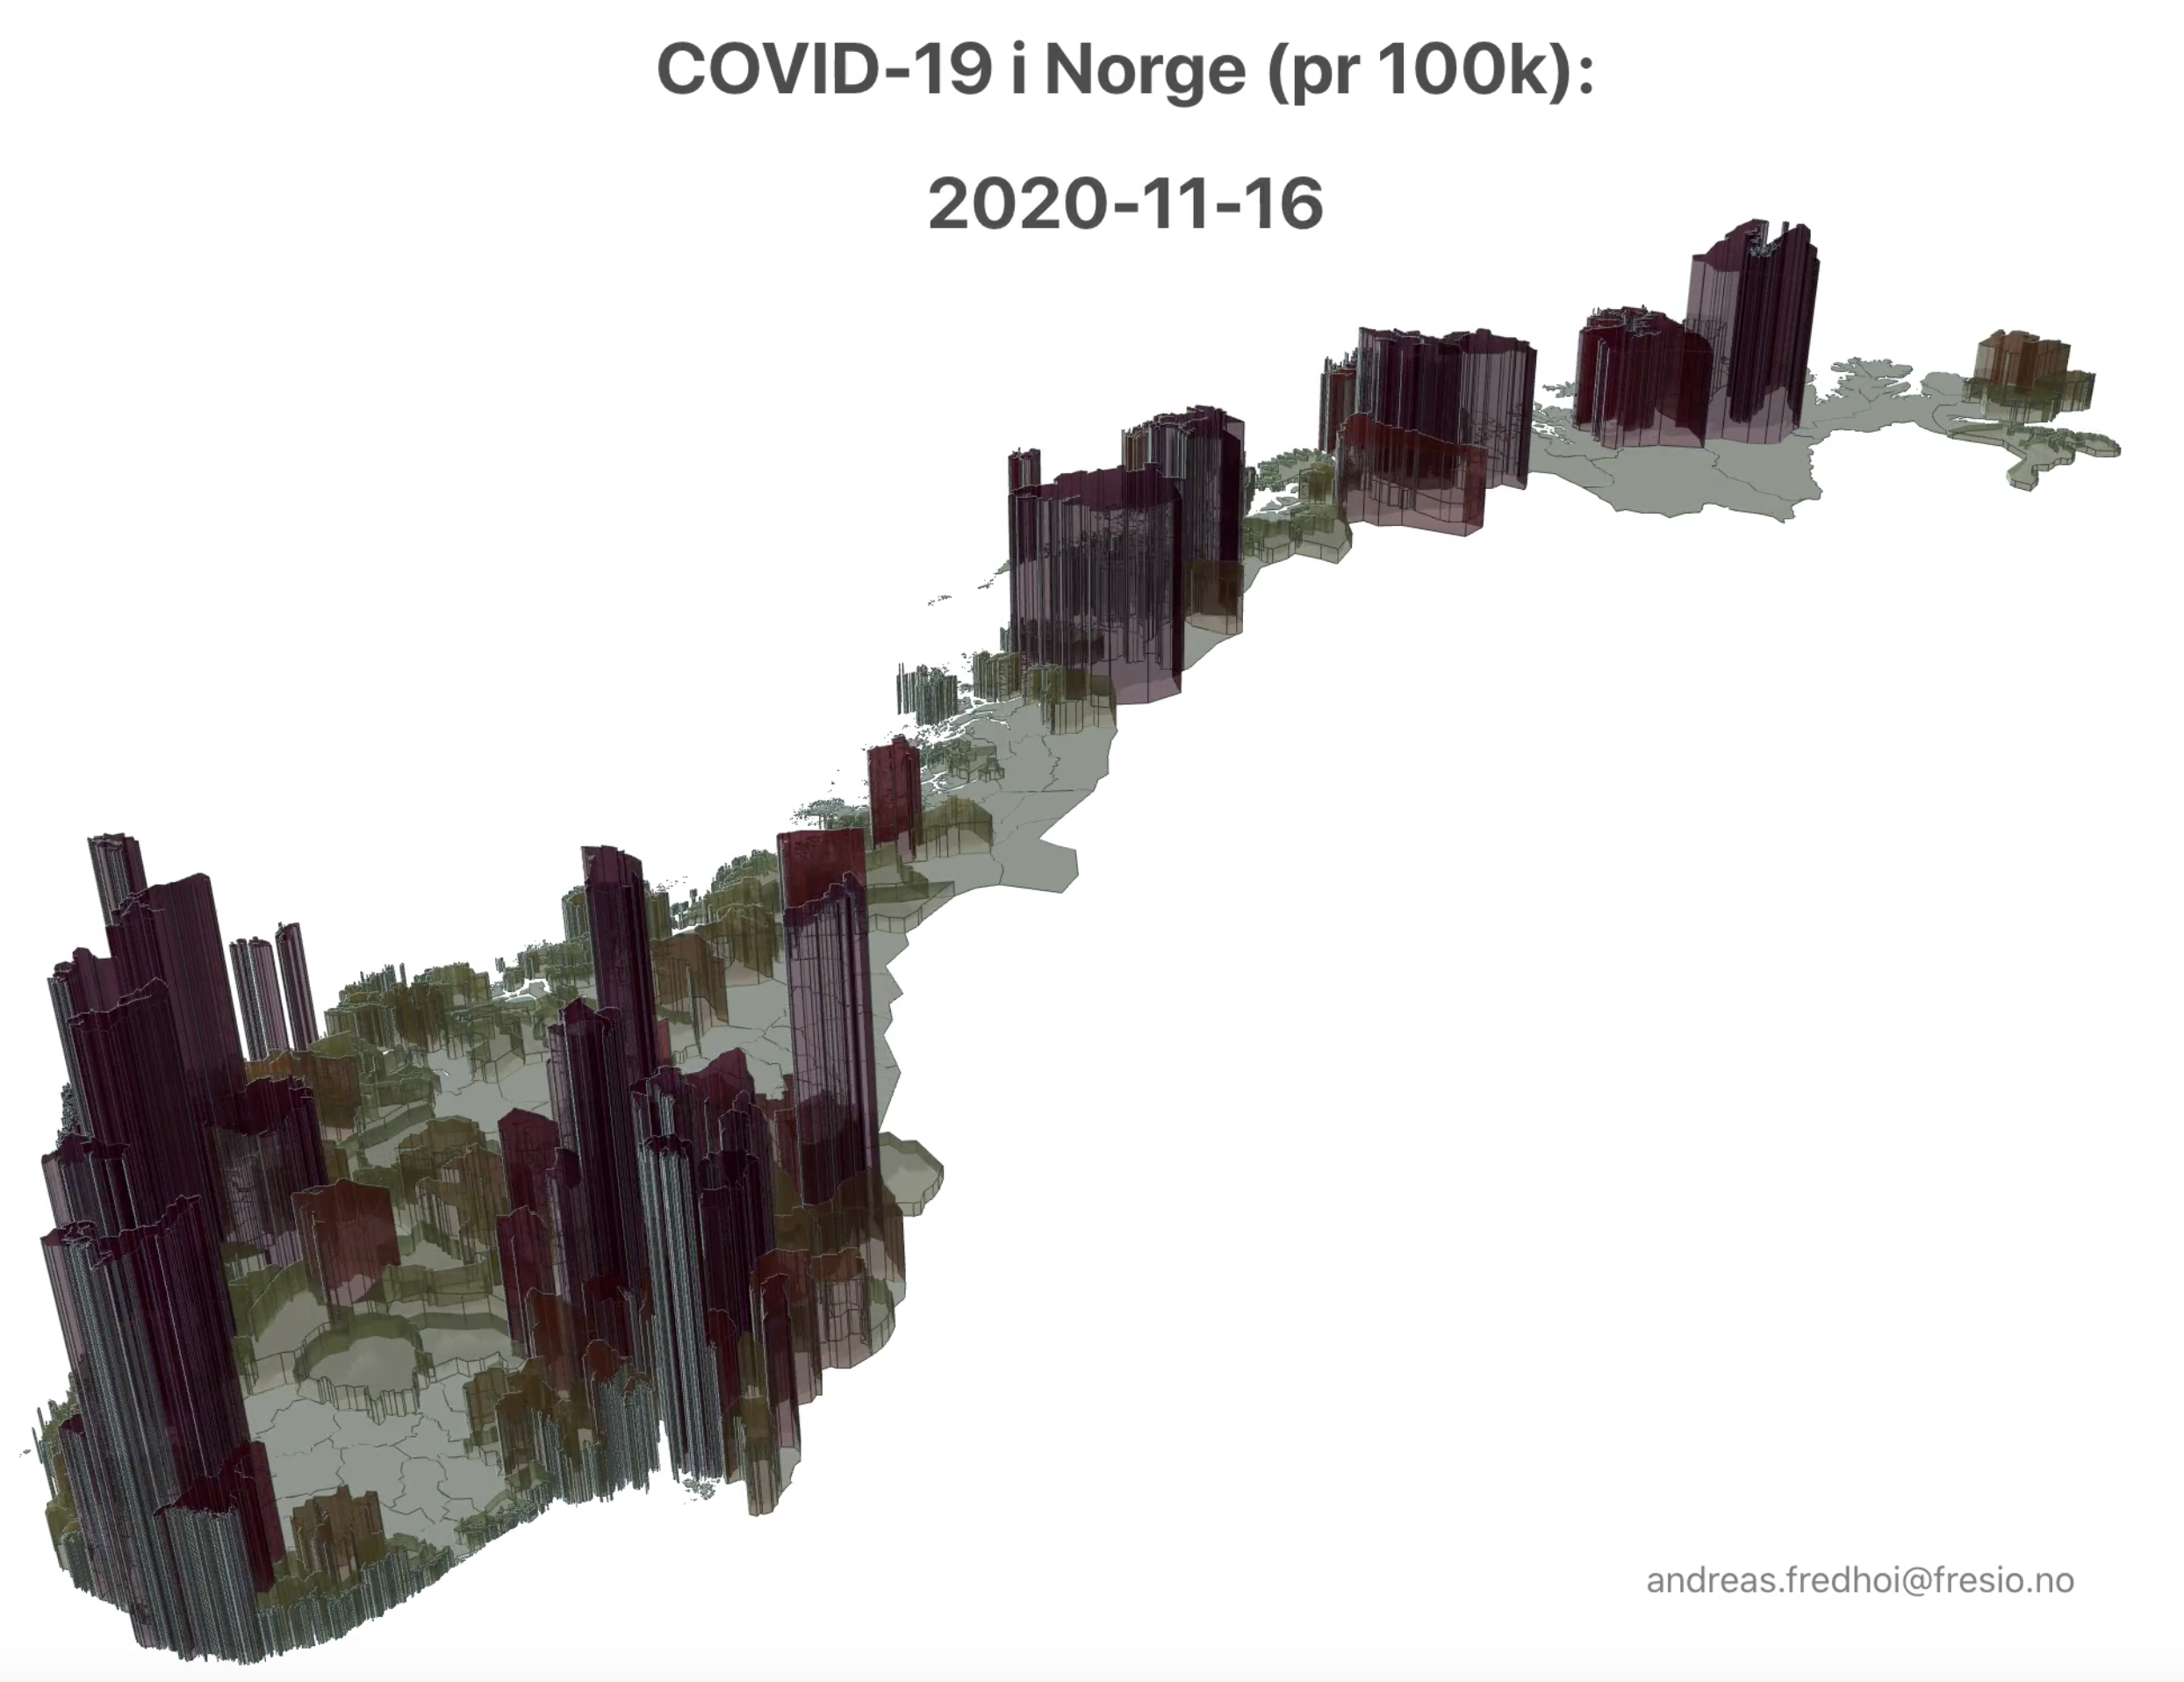
The viz is inspired by this reddit post on r/dataisbeautiful. Deck.gl/react has been used to create […]
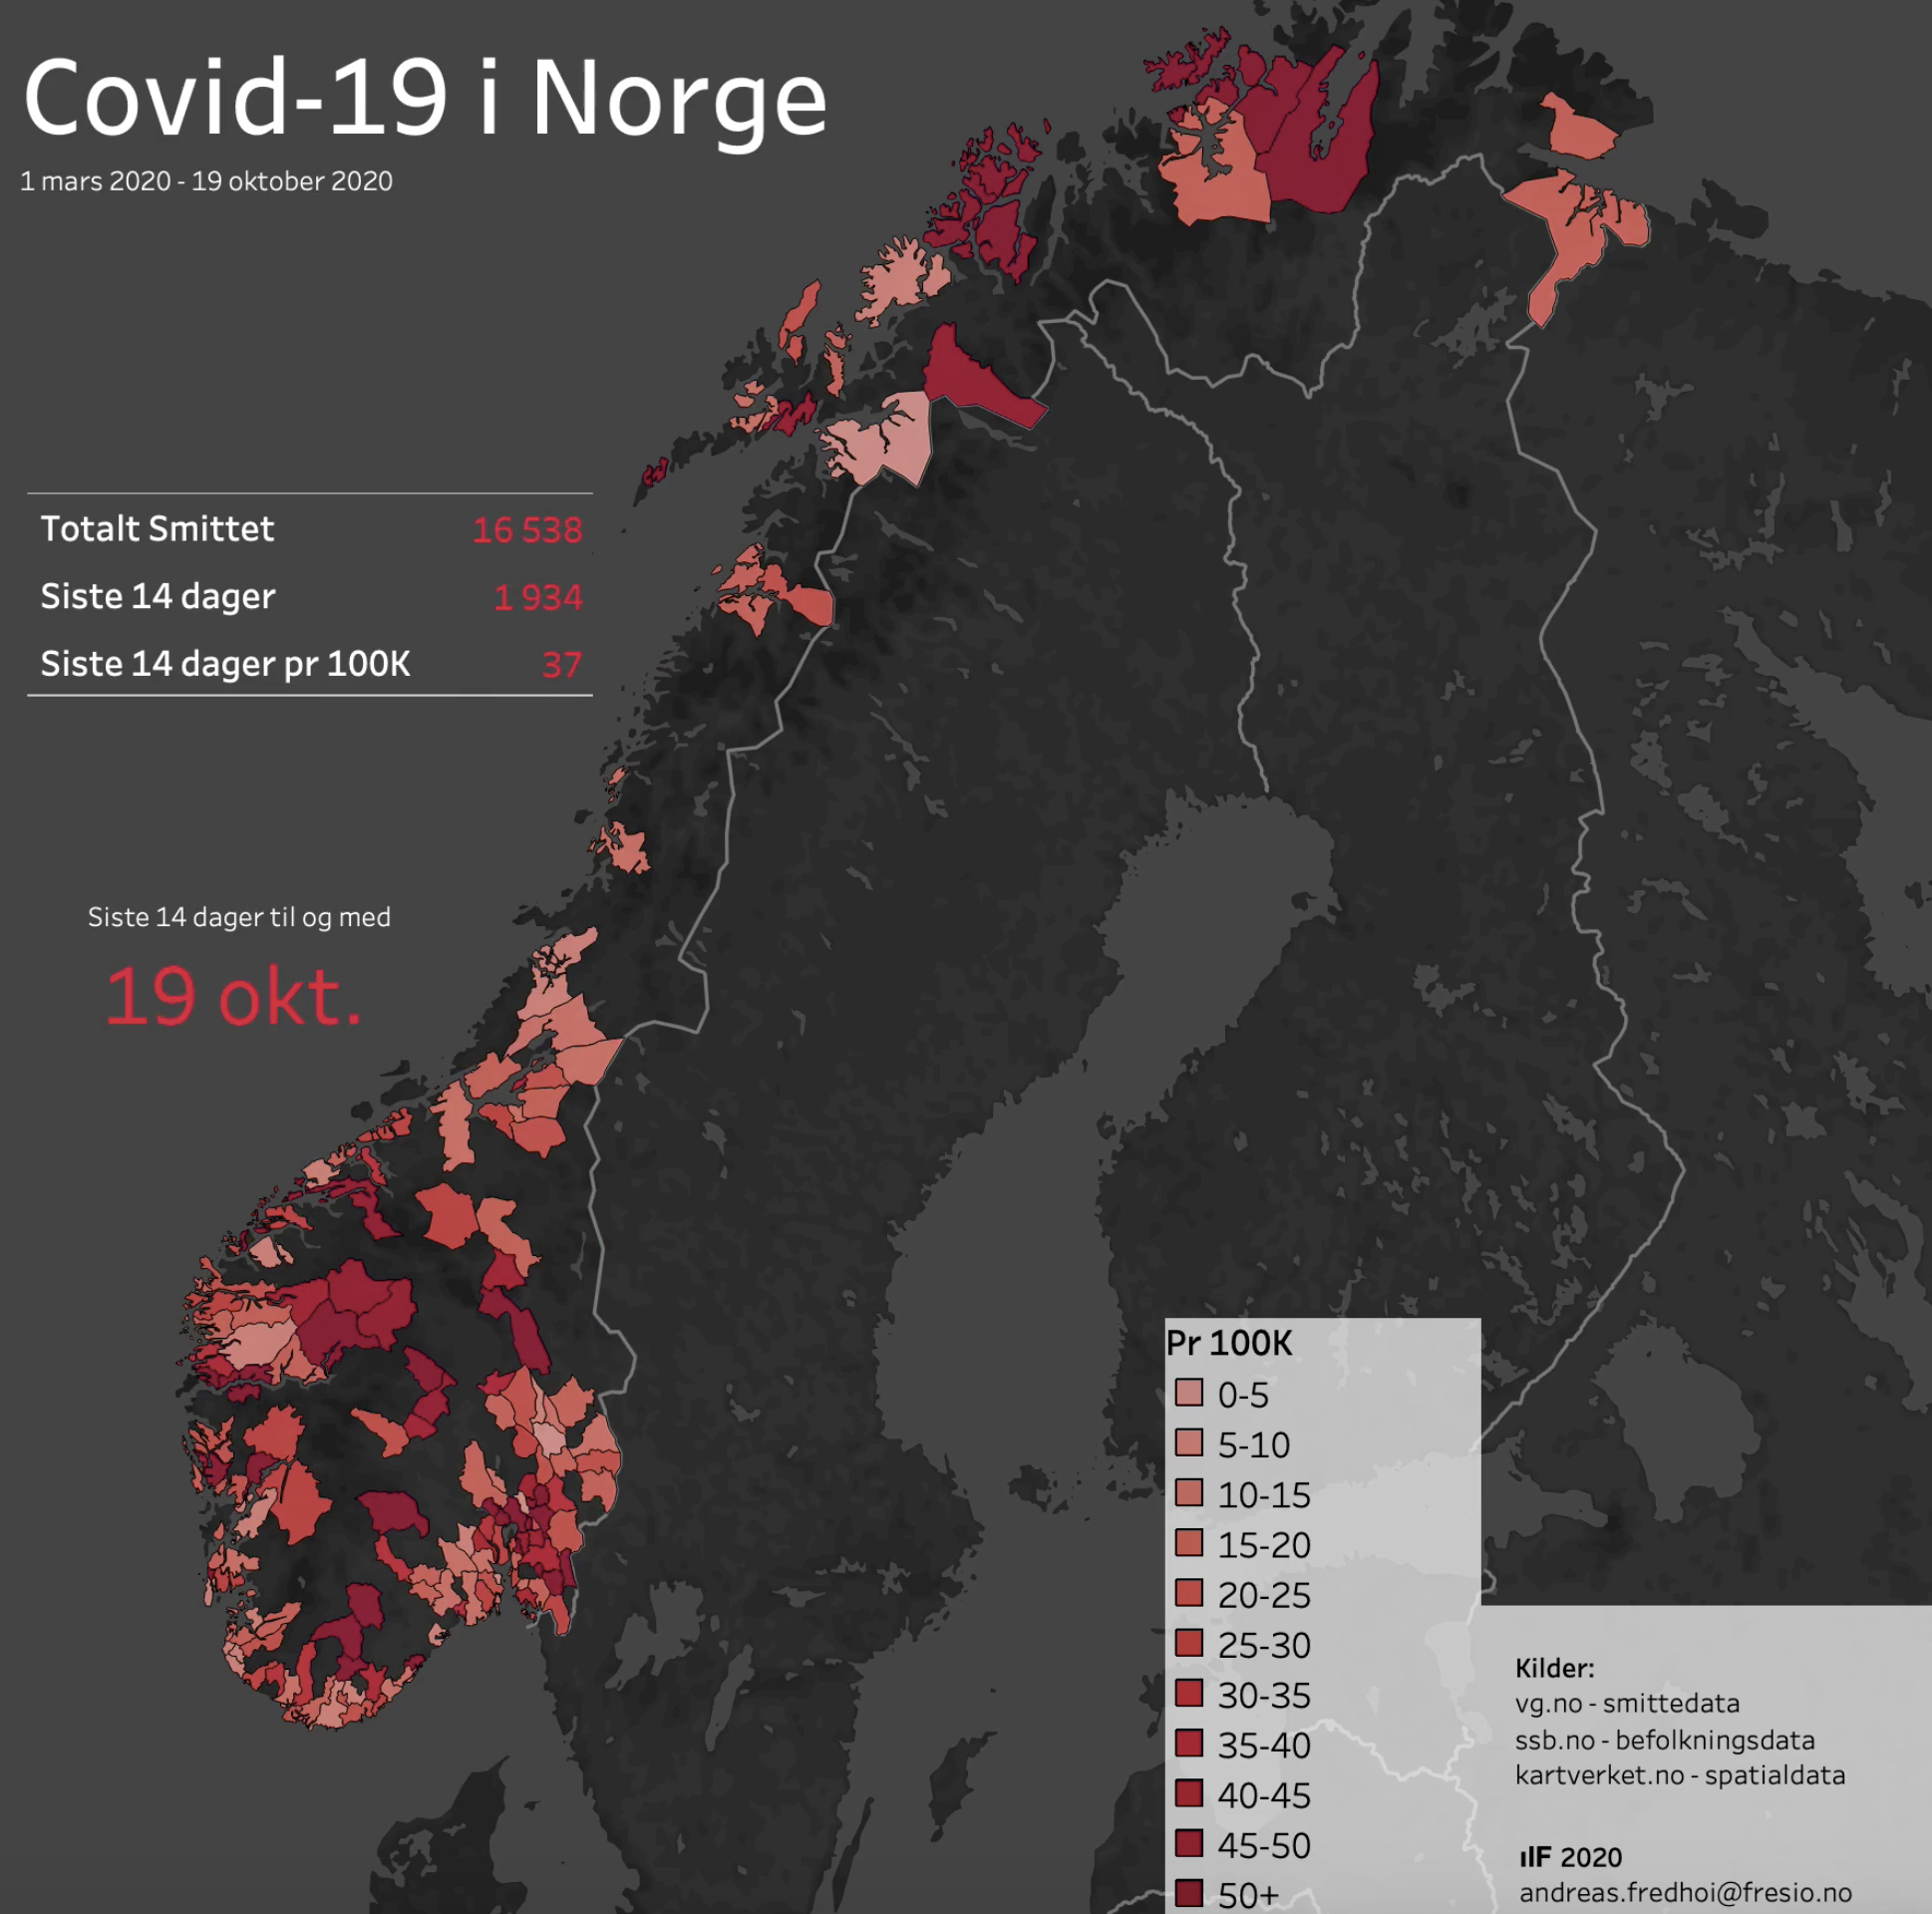
Building a simple overview of Covid 19 exposure in Norway over time Getting the data Infection […]
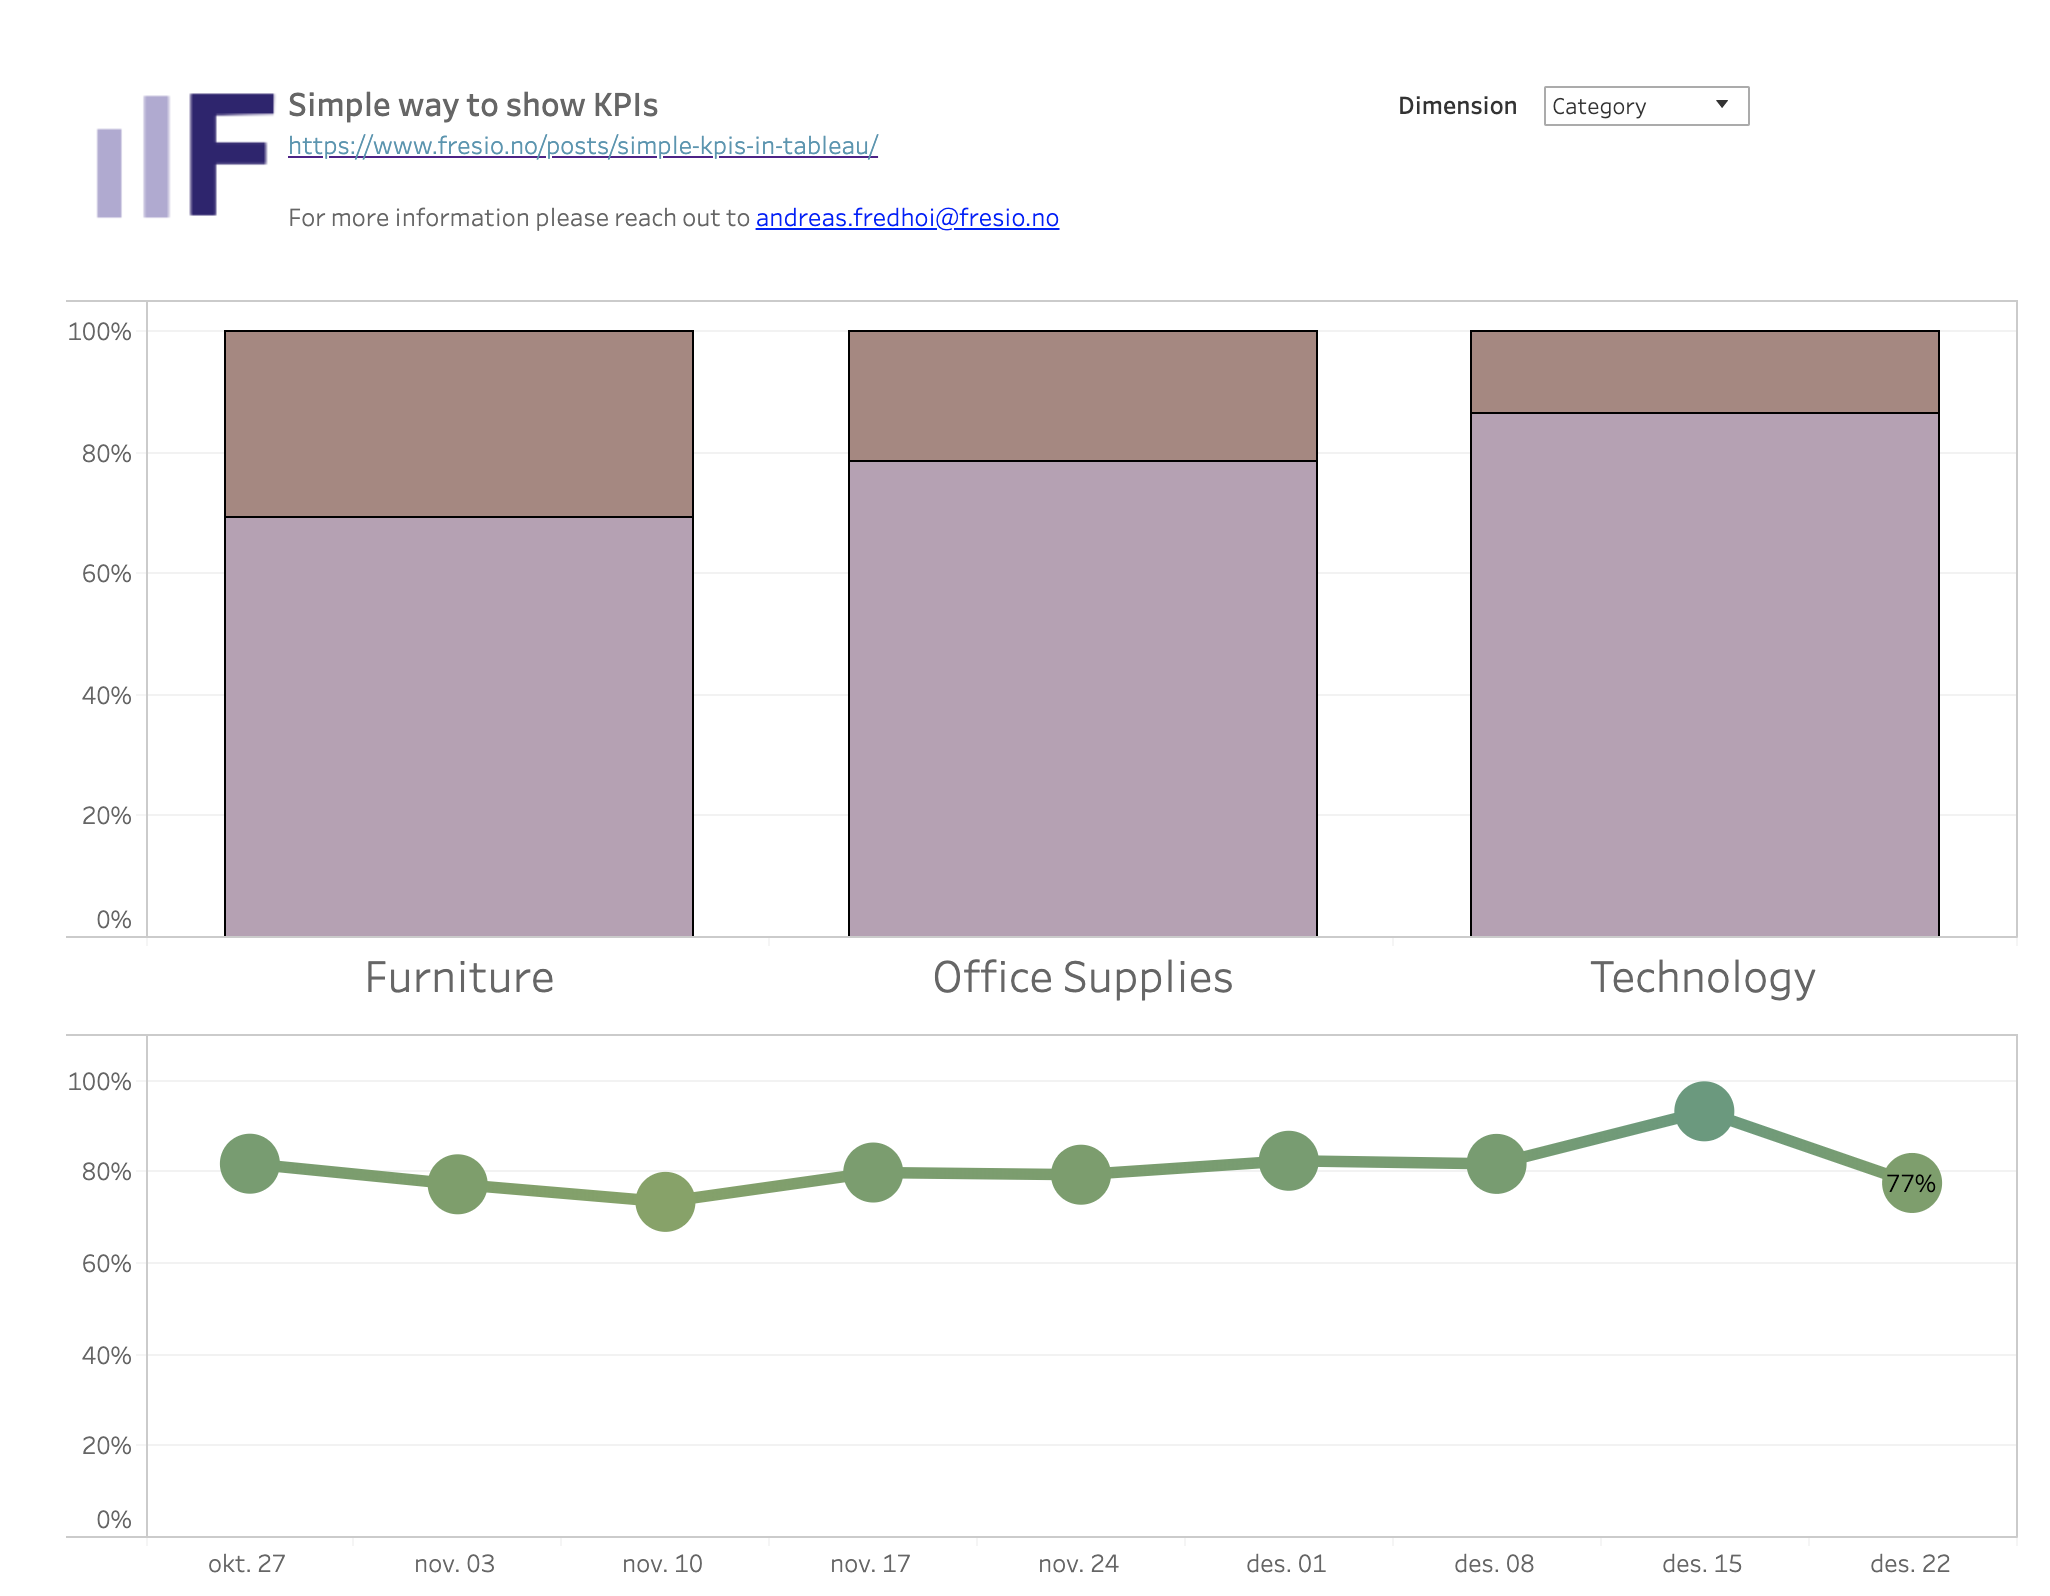
In this dashboard I will show you a simple way of creating KPIs including trend lines. […]
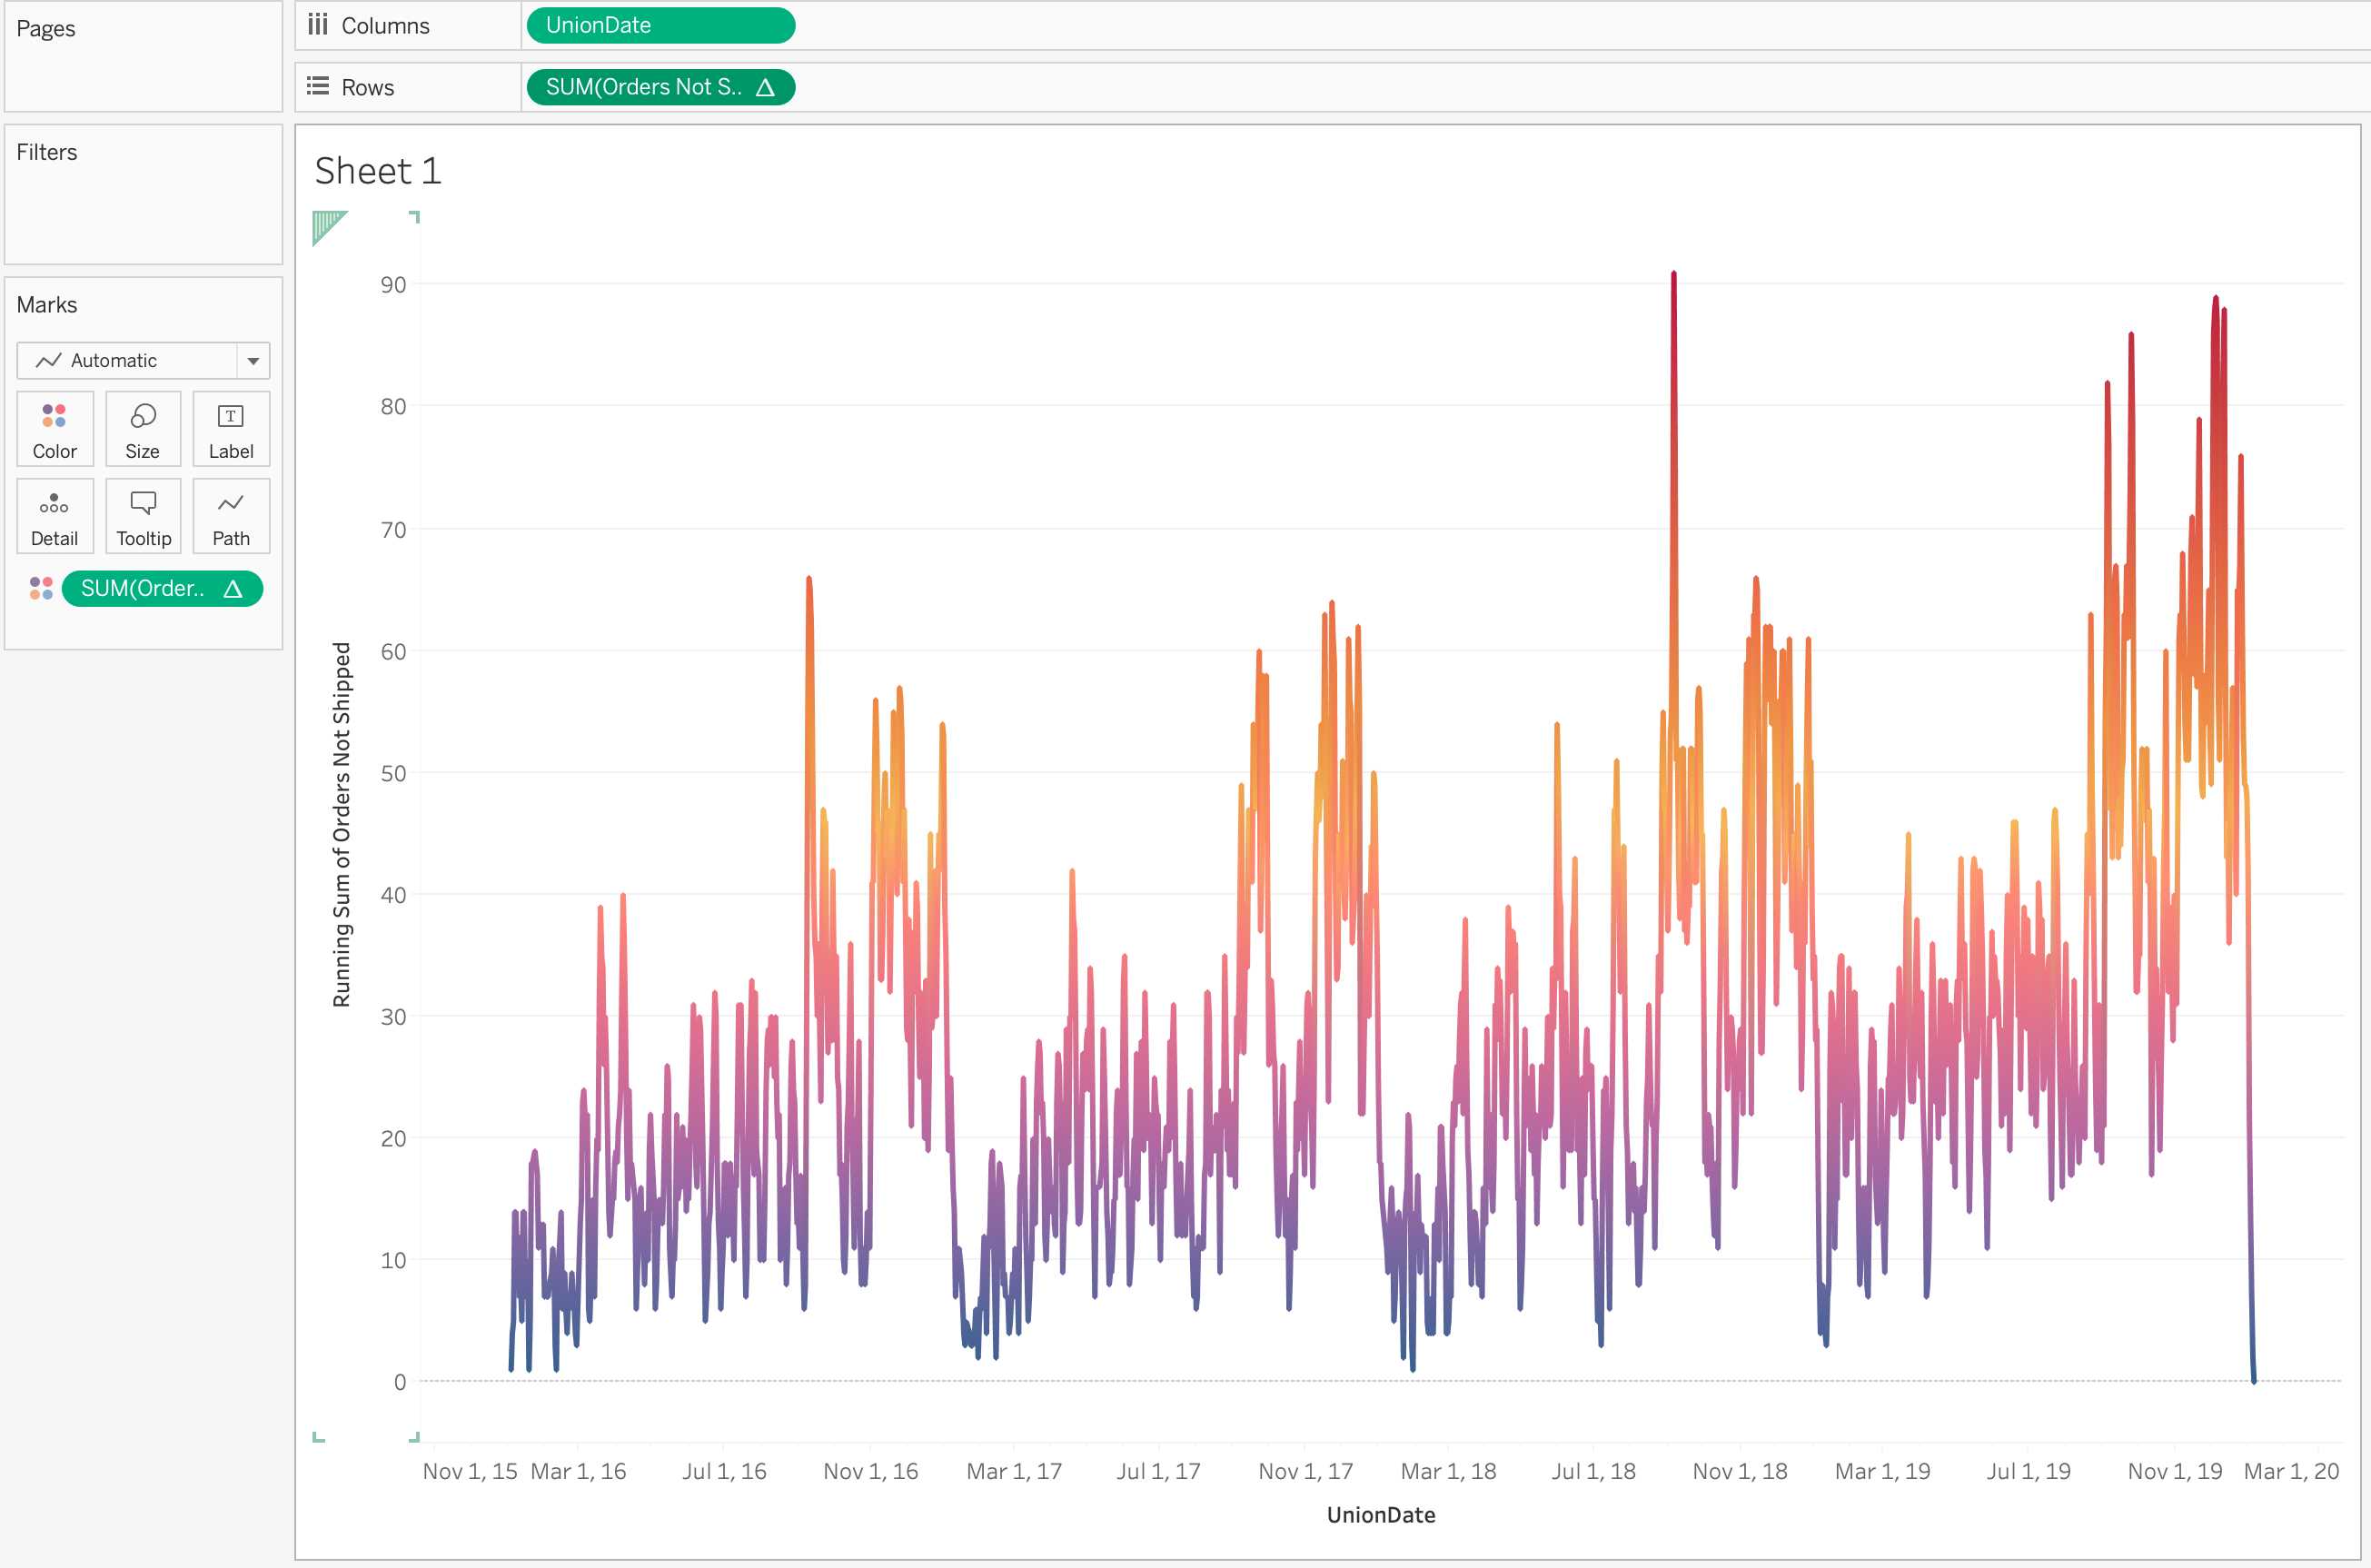
A common use case when looking at log files or data for ticket requests is to […]